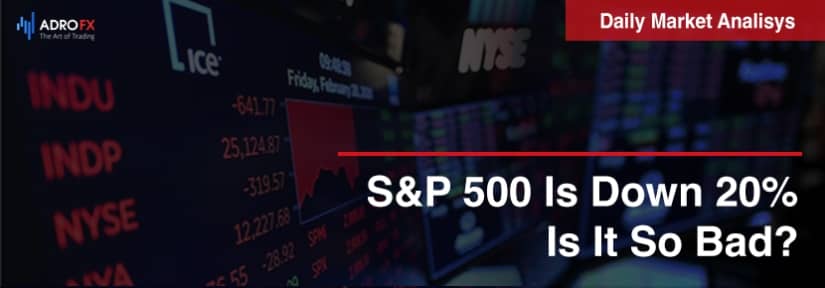
S&P 500 Is Down 20%. Is It So Bad? | Daily Market Analysis
Key events:
Switzerland - SNB Interest Rate Decision (Q3)
Switzerland - SNB Monetary Policy Assessment
Switzerland - SNB Press Conference
UK - BoE Interest Rate Decision (Sep)
UK - BoE MPC Meeting Minutes
USA - Initial Jobless Claims
After last week's CPI release, the S&P 500 Index is back in a bearish rut. Looking at stock market data for the first 180 trading days (that's how many trading days so far this year) for the period 1928 through 2022, we see that despite the short-term summer recovery, the S&P 500 has so far posted its sixth-best performance since the end - its performance has only been worse five times.
The S&P 500 has fallen 1 percent or more this year for 12 Fridays. In the past 70 years, which is how long the markets have had a 5-day trading week, there have only been five other years with so many strong Friday drops. These are 1974, 2000, 2001, 2002, and 2008. What all of these years have in common is that they were unfavorable for the stock market.

The chart above shows the 20% drop of SPX price since the beginning of this year
There are still quite a few Fridays left before the end of this year, so the market could renew its record, mainly because there were 12 more Fridays left at this point in 2001, 13 Fridays in 2002, and 14 Fridays each in 1974, 2000, and 2008. This year there have already been 12 Fridays with a drop of 1% or more and there will be 15 more Fridays, so there should be no problem updating the record.
After last week's 5.8% drop (the biggest weekly drop since January), the Nasdaq 100 has now established itself as the worst performing index of the year so far. Last week's drop was the third weekly pullback of more than 4% since the summer rebound in mid-August.

META chart
Some companies deserve a special mention. For example, shares of Meta Platforms (NASDAQ: META) reached their lowest levels since early 2019, falling 14%. Shares of NVIDIA (NASDAQ: NVDA) are trading at their lowest levels in a year and a half following an 8% drop. Shares of FedEx Corporation (NYSE: FDX) collapsed 20% in a single trading day, marking their worst daily decline since their stock market debut in 1978 (the previous anti-record, set on Black Monday, Oct. 19, 1987, was -16%).
On top of that, nine Nasdaq 100 companies hit new lows last Friday, including Alphabet (NASDAQ: GOOGL), Intel (NASDAQ: INTC), and Zoom Video Communications (NASDAQ: ZM).
In addition, the U.S. Federal Reserve raised its key rate by 0.75 p.p. to 3-3.25 percent, according to the regulator's website. This is the third consecutive rate hike in such a move. The decision was quite expected, earlier analysts had reported a rate hike of 75 bps. Moreover, the futures market had laid out an almost 85 percent chance of a 75-point hike.

U.S. 2 Year Treasury
U.S. 2-year Treasury bond yields are likely to continue rising in the coming months, bringing the inverted yield curve to levels last seen in the 1980s.
Analysts are already saying that yields on 2-year Treasuries could rise to 4%-4.5% and 10-years could fall to 3%.
However, the inversion of the yield curve in the past has not prevented the S&P 500 from continuing to rise, except in 1973. The index continued to move in an uptrend for another 11 months, averaging an 8% gain over those periods.
The Japanese yen continues to rapidly lose ground against the U.S. dollar, falling to its lowest level in 24 years. One of the reasons is the strong divergence in the strategy of the Fed and the Bank of Japan.
There are talks about the possibility of intervention by the Japanese central bank in the currency market, but we should not forget that in past Japan was helped by America. Japan is unlikely to be able to do much on its own this time around.

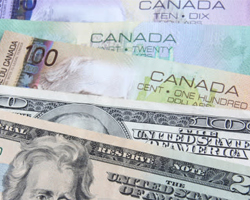
The chart above shows recent decline in major currencies
The Euro continues to bear losses as the European Central Bank (ECB) lags behind the Fed in raising rates. In addition, Europe's economic outlook is worse due to the energy crisis while the U.S. has energy independence.
The pound has fallen to a 37-year low against the U.S. currency. Since the beginning of this year, the pound has lost 16%.
The New Zealand dollar has joined the list of "victims" and is now approaching its 2020 lows, trading in a downtrend.
The Canadian dollar has also fallen against the dollar, reaching its lowest level in almost two years.
The Swiss franc (unexpectedly) declined against the dollar. Although it has managed to regain some ground since May, the long-term scenario has not changed. The Swiss National Bank is likely to move away from its policy of negative rates at its meeting today.
Related Articles


Latest updates
Latest updates


Technical Analysis
Latest updates


