Wolfe Wave Pattern Trading Guide
The Wolfe Wave pattern is a trading method, which was originally invented by Bill Wolfe and is described in detail and clearly in his book. Wolfe's method, of course, was developed specifically for the stock market of those years, but now you can see his markup on currency pairs and other instruments as well. Thus we can safely say that Wolfe waves can be applied boldly to the forex market.
What is the Wolfe Wave Pattern
It is a graphical model, such as a "triangle" or "head and shoulders", which, according to the author, is based on the model of technical analysis called "wedge". Moreover, the author speaks of the simplicity of the method, the most important thing is to be able to simply draw trend lines, and we need a price chart of absolutely any instrument and it does not matter in what time frame we observe the formation of Wolfe waves. In addition to the entry point into the market, using the tactics of waves trading, we can also determine the purpose of the model working out and the estimated time of reaching this goal. However, the author himself mentions that we should not completely trust time one hundred percent. After all, time in financial markets is a rather slippery parameter.
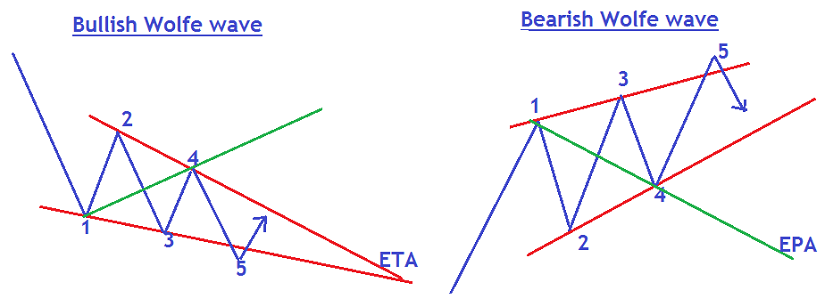
There are two types of Wolfe waves - a bullish Wolfe wave, i.e. the structure of the model to buy, and a bearish Wolfe wave, i.e. the model that speaks about the sales of a financial instrument. Bill Wolfe in his book fully discloses the rules of building these models.
Bullish Wolfe Wave Pattern
The bullish Wolfe Wave pattern is a series of differently directed waves that form a price pattern. Each wave is designated by a certain number:
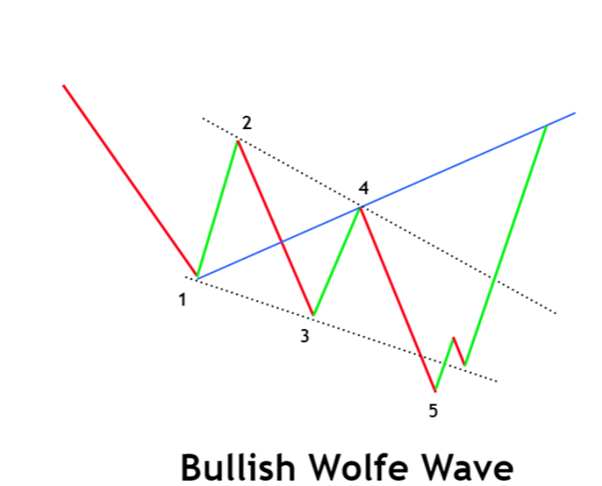
- * Wave 1 - the base of the pattern
- * Wave 2 - any significant top. Going beyond the maximum of wave 1 is optional.
- * Wave 3 - a new minimum. This wave must always break out the minimum of wave 1.
- * Wave 4 - always goes beyond the minimum of wave 1, but must never go beyond the maximum of wave 2.
- * Wave 5 - a new low, goes beyond the minimum of wave 3.
- * Wave 6 - begins after the end of wave 5 and is the most powerful of all the waves in the Wolfe model.
It is possible to identify the Wolfe wave only when the first four waves are formed, and it is best to trade only in wave 6. Moreover, all work with the Wolfe waves is associated with trading in wave 6.
When waves 1, 2, 3, and 4 are formed, two lines can be drawn, which are considered basic. The first line is drawn on the minimum of wave 1 and maximum of wave 4 and serves as a target for the end of wave 6.
The second line is drawn on the minimums of waves 1 and 3, it is the approximate level of the completion of wave 5 and the beginning of wave 6. Wave 5 may sometimes not reach, or cross this line. We will consider this phenomenon later.
To start trading in wave 6, it is desirable to obtain confirmation of its beginning. To do this, you can use a breakout of the Moving Average with such a period that the indicator provides support for wave 5. Also, you can use the trend line drawn from the maximums of wave 5.
Another confirmation could be the formation of a candlestick pattern at the end of wave 5 on lines 1-3, as well as the wave reaching a significant Murray or Moving Average level.
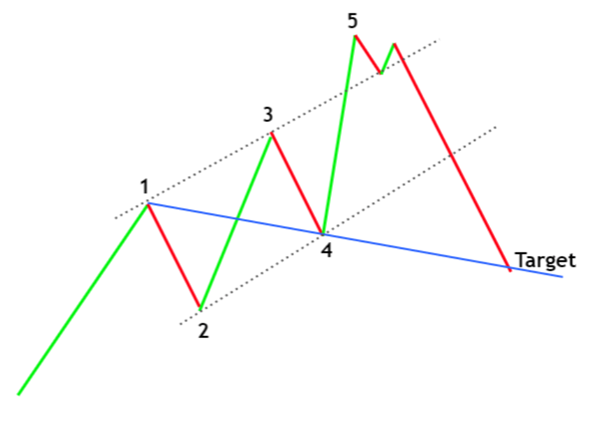
Bearish Wolfe Wave
The bearish Wolfe wave is the mirror image of the bullish variant.
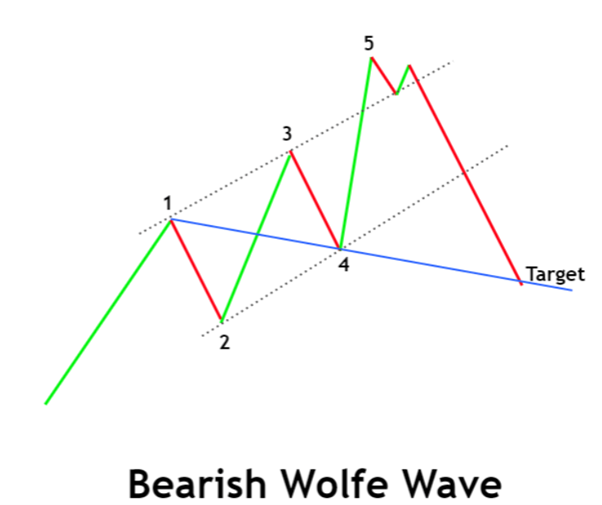
In the bearish variant, all the rules discussed above are diametrically opposed:
- * Wave 1 - top of the pattern
- * Wave 2 - any significant trough. Going beyond the minimum of wave 1 is optional.
- * Wave 3 - a new maximum. This wave must always breakout the maximum of wave 1.
- * Wave 4 - always goes beyond the maximum of wave 1, but must never go beyond the minimum of wave 2.
- * Wave 5 - new maximum, goes beyond the maximum of wave 3.
- * Wave 6 - begins after the end of wave 5 and is the most powerful of all the waves in the model.
Like a bullish variant, only wave 6 is traded in a bearish mode, which may sometimes not reach the line of waves 1-4, and may even break it out.
At first, it can be difficult to identify bullish and bearish Wolfe waves. Beginners may be confused by the rules. Therefore, it is necessary to study the theoretical part carefully.
Conditions for Drawing Waves
In order to finally verify the formation of the Wolfe wave, it is necessary to subject it to a certain test. For a bullish pattern, initially the "two", that is, the first top is identified. Then the "three" is identified and only after that is the "one" which should be higher. They are followed by "four" and "five". The last one is ideally located right on the line, built through minima 1-3.
At the next step, the EPA, a tentative price line on arrival, is drawn through the "one" and the "four". As soon as the price chart reaches it, the moment of profit taking comes. We can find the ETA when we see the connection of the lines going through the "two-four" and "one-three".
For a bearish pattern, the "two"-first trough is also identified first. Then look for "three", "one", "four" and "five". The EPA line is plotted through 1-4, the ETA point is formed from the crossover of 1-3 and 2-4.
The Perfect Wolfe Waves
The more perfect the wave, the higher the probability that the price will reach the set Take Profit. Ideal patterns are formed rarely, to find them is big luck. Let us review the requirements for the perfect waves.
The "two" must be a local peak/trough.
The figure formed by lines 1-3 and 1-4 is called "nose". It is required that they are located symmetrically with respect to the horizontal line drawn through the "one". At the same angle should not be obtuse.
The distance between the "one" and the "two" contains more candlesticks than in waves 3-4. In addition, these segments are parallel or close to it.
"Three" stays within the borders of the channel formed by the lines through 1-2 and through "four".
"Five" coincides with lines 1-3. It is formed by not too many candles, that is, it is not stretched in time. "Five" should be shorter than "three".
The group of points 1-2-3 is assembled less compactly than 3-4-5. The distance between the "three" and "five" is shorter than the distance of segments 1-3.
Peculiarities of Point 4
After the formation of the first three points, there often comes a flat. During the consolidation period, it is difficult to identify the fourth point, because several price spaces fit the definition at once. This does not mean that it is necessary to skip an area. Such situations can also be used. The difficulty lies in the fact that when confused with 4, it is impossible to determine 6 because to find it, you need to draw a ray from 1 to 4. Proceed as follows: from point 1 draw a few bars through all of the alleged points 4.
It turns out a lot of targets for fixing the profit. As we get closer to 6, we select one of the possible courses of action:
- Close the order at the first crossover;
- Fix profit partially at each touch;
- Move Stop Loss after approaching 6 until the price reverses;
- Use a Trailing Stop.
All methods work and are allowed by the system rules. You need to act according to the situation.
Sweet Zone
A sweet zone is formed when drawing a price channel. One boundary is built through points 2-4, the parallel boundary passes through the "three". The area highlighted in the figure is called the Sweet Zone.
The point is that the "five" rarely coincides with lines 1-3, as we have already mentioned. Its presence within the zone confirms that the considered pattern is a Wolfe wave. In some cases, one of the channel lines is built through the "one".
The correct wave must also meet these conditions:
- The line drawn through 2 parallel to the segment 1-3 must be above (bullish) or below (bearish) the "four".
- Lines 2-4 and 1-3 necessarily converge, unless it is a perfect wave.
Wolfe Wave Indicators for MetaTrader 4
If a person is new to wave analysis, difficulties may arise with the search. In this case, some indicators find graphical figures on the chart. Some of them mark immediately the recommended entry points. Let us consider popular tools used in the method.
PZ Wolfe Waves
The algorithm draws thick lines, marking the bends of the pattern. Marks the arrows showing the moment of opening a position. Blue bars are bullish patterns and red bars are bearish patterns. The target is marked with a dotted line.
You can set up the following parameters:
- Display of large and small models,
- Number of bars for the analysis,
- Zero points,
- Alerts.
The program gives a lot of signals and this has its own disadvantages:
Some of the patterns overlap with each other. For this reason, the chart itself can hide behind the markup, which makes it difficult to find entry points.
Not all readings are correct, especially in low time frames. This is due to the fact that the algorithm does not take into account all the nuances of the construction and may overdraw, resulting in a lot of false signals. Therefore, it is important to learn to check the signals manually.
Nevertheless, the indicator is good at showing how and where to look for the starting points.
Wolfe Wave Finder
This indicator builds waves based on extrema, which are determined by the Zig Zag algorithm. Puts the key figures, and draws the breakout and the target band.
Wolfe Wave Finder does not clutter up the terminal too much, because it starts building after the previous ones are finished. The program schematically marks the pattern, leaving space for an independent analysis.
The disadvantage of the algorithm is the presence of false signals. The algorithm does not observe all the nuances of the construction, and therefore the points can be located chaotically, and it is better to confirm the reversal pattern manually.
WolfWavesFind
This algorithm allows for flexible tuning. The proportions do not change, which is important for the correct identification of the figure. The MACD divergence search is built in as a filter allowing to estimate the signal strength.
A disadvantage of the algorithm is that it does not consider the previous data in its calculations. You will have to analyze this point by yourself.
WolfWavesFind gives better notifications than the previous two. It can be used as a working tool in the beginning.
How to Trade Using Wolfe Waves
We have dealt with the theoretical part, now let us consider how to apply Wolfe waves in practice. As is already clear from the above, the buy point in a bullish wave and the sell point in a bearish wave is point 5.
That is, the trader's task is to correctly identify the Wolfe wave, and wait for the formation of point 5 (as already described, it is formed at the crossover of price and the ray that connects points 1 and 3), and open a position.
Finally, the trader must fix profit by closing the position at point 6 (formed by the crossover of price and the ray that is drawn through points 1 and 4).
Stop Loss and Take Profit based on Wolfe Waves
Let us find out how to determine the location of the Stop Loss and Take Profit level in this situation. Stop Loss level on the Wolfe wave is set below the crossover of lines 1-3 and lines 2-4, the price may fall to this level and the author marks the area below the "neckline" as a "sweet zone", but is it worth it to wait for the losses. To determine the targets - draw a vertical line at the crossover of lines 1-3 and lines 2-4, and look where this vertical line crosses lines 1-4 - at this point and can be guided by the targets of the Wolfe model. Moreover, the vertical line will show the approximate time to reach the goal.
If the lines do not cross and there is no possibility to determine the Stop Loss and Take Profit, then it is possible to look for small models or, if the Wolfe wave is directed towards the trend, just buy from the "neckline" with a close stop.
Advantages and Disadvantages of Wolfe Waves
The main advantage of the method is that it is based on the fundamental laws of the market. The struggle between supply and demand is present in all instruments. This means that wave analysis will always be relevant and will not become obsolete like many new-fangled techniques. The strategy gives quality signals that help to make large profits.
Disadvantages - as with all methods of graphical analysis. Finding patterns is subjective, despite standardized signs. Two people can see an opposite situation and draw different constructions in the same conditions.
In the process of training on history, the trader can find a lot of perfect patterns. At the moment of real trading, it turns out that this is rare. The proportions are violated, and it is necessary to wait for the appearance of a good signal. In this case, the analysis is time-consuming, the eye gets tired and errors occur.
The creator compares traders to surfers who must learn to catch a wave in order to start trading profitably with their method.
When the picture does not match the ideal pattern, it requires the use of auxiliary filters to confirm entry. This complicates the trading system.
Wolfe Waves Trading Tips
In his book, Bill Wolfe gives recommendations on the application of the developed strategy. Many of them are related to psychological factors. For example, the author advises being patient, working strictly according to the plan, and keeping a trading journal. But there are also practical nuances that can improve trading according to his theory:
- Watch for tick volumes. They fall in the sections of the movement and grow when approaching the key reversal areas;
- Look for the places where the trend is broken. The structure appears flat, but such areas are not very profitable. It is more profitable to trade strong directed movements;
- To work on several time frames simultaneously. It is possible to trade on the dominant wave, as well as in the lower time frames;
- Exit at the first sign of trouble. This is a reverse wave, with unusually large volumes and any atypical behavior of the quotes;
- Use М5 and М15 for intraday trading;
- Limit potential losses;
- The appearance of the next pattern cancels the previous one;
- You can trade gaps only after gaining experience. It is dangerous for beginners.
Summary
All in all, Wolfe waves is a fairly reliable pattern that allows you to trade in both the stock and currency markets. These patterns can be looked for on charts with any time frame (they show good results regardless of the chosen chart time frame).
Basically, Wolfe waves can become the basis of a trading system, but it should not be forgotten that any pattern of technical analysis works best when combined with its other tools. Therefore, always look for confirmation of Wolfe waves signals from other indicators.
Related Articles


Latest updates
Latest updates


Technical Analysis
Latest updates


