A Beginner`s Guide to Successful Trend Trading Strategies and Risk Management

Understanding and navigating the intricacies of trend following is a key aspect of successful trading. In the dynamic world of financial markets, trends emerge as assets move consistently, either upwards or downwards, over defined periods. Trend following, as a fundamental strategy, revolves around identifying and aligning with these ongoing price movements. Traders employing this strategy ride the trend until they anticipate its conclusion, seizing opportunities in both bullish and bearish scenarios. While trend trading can be a rewarding approach, it comes with inherent risks, especially for those new to the trading arena. This article explores the nuances of trend following, distinguishing it from momentum trading, examining reversal versus trend trading, and delving into breakout strategies.
What Is the Trend Following?
To begin with, a trend manifests when the price of an asset moves consistently either upward or downward over a defined period. For instance, if a stock progresses from $10 in January to $15 in February and reaches $18 in March, it indicates a bullish trend. Conversely, if it moves from $10 to $8 to $5 during the same period, the stock is in a bearish trend. When the price fluctuates within a certain range, it signifies a consolidation phase rather than a trend.
Trend following, therefore, is a fundamental strategy centered on identifying assets with ongoing upward or downward price movements and aligning with the trend. Traders adhere to this trend until they sense its conclusion. In the event of a transition from a bullish trend to a bearish one, traders may short it to capitalize on the downward movement.
Trend trading, when executed effectively, can be a lucrative approach. Nevertheless, it carries inherent risks, particularly for newer traders, as discussed below.
Distinguishing Between Momentum and Trend Trading
While trend and momentum trading share similarities, they differ in some aspects. Trend trading involves buying or selling an asset based on its upward or downward movement, aiming to ride the trend until its completion. Momentum, on the other hand, gauges the speed or velocity of an asset's price movement, with traders or investors opting for assets exhibiting robust momentum. The meme stock era of 2021, featuring companies like GameStop, AMC, and Bed Bath & Beyond, exemplified strong momentum plays.
Reversal vs. Trend Trading
The contrast between reversal and trend trading lies in their fundamental approach. Trend-following seeks to enter a trade when an asset is already in an established uptrend or downtrend. Reversal trading, however, aims to enter a trade precisely when an asset is poised to change direction. While reversal traders initially anticipate a change, they eventually align with the existing trend until its conclusion, employing various methods such as double-top and double-bottom patterns and candlestick patterns like hammer and doji.
Breakout vs. Trend Trading
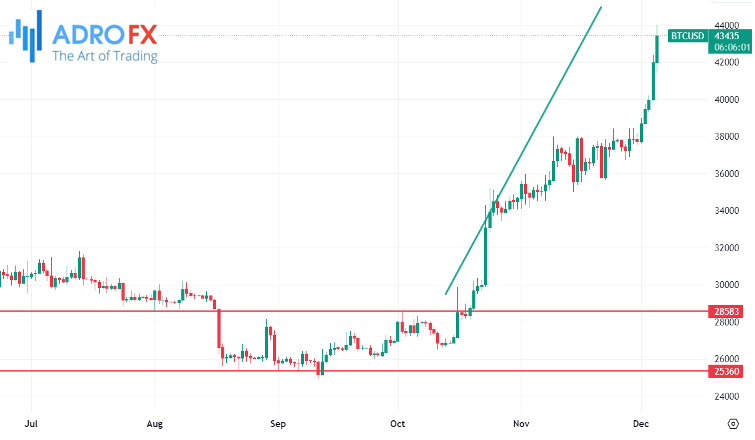
Trend trading focuses on benefiting from existing trends, either buying and holding assets as they rise or selling assets in a downtrend. In contrast, breakout trading operates differently. This strategy comes into play when an asset remains within a specific range for an extended period. Upon a breakout, the trader transitions into a trend follower, aiming to hold the asset until the trend concludes. A prime example is illustrated in the chart below, where Bitcoin's bullish breakout is confirmed as the price surpasses the resistance point at 28,583 after being confined within the range of 28,583 to 25,360.
How to Recognize a Trend
The most straightforward method to identify a trend is through visual inspection of a chart. Observing the chart visually allows you to determine whether an asset is in an uptrend, downtrend, consolidating within a tight range, or experiencing high volatility.
However, relying solely on visual inspection is insufficient. It is advisable to conduct a multi-timeframe analysis to validate the existence of a trend. This entails examining the chart across multiple timeframes, typically three, to gain a comprehensive perspective. This approach proves beneficial as a chart that appears unremarkable on the daily timeframe may reveal a discernible trend when viewed on an hourly chart.
How to Analyze a Trend
Identifying a trend marks the initial step in trend-following, followed by a thorough analysis aimed at determining entry and exit points.
Key steps in trend analysis include:
- Multi-Time Frame Analysis
Always conduct a multi-timeframe analysis to ascertain the broad-based nature of the trend. - Incorporate Trend Indicators
Integrate various trend indicators into the chart. Oscillators such as the Relative Strength Index (RSI), Stochastic, and Money Flow Index (MFI) provide insights into overbought or oversold conditions. Trend indicators like moving averages, Bollinger Bands, and Donchian Channels help assess the trend's strength. Indicators such as the Average Directional Index (ADX) and Supertrend provide additional information on trend strength. - Chart Patterns
Identify emerging chart patterns, differentiating between reversal and continuation patterns. Understanding these patterns aids in predicting whether a bullish trend will persist or if a reversal is imminent. Notable chart patterns include flags, pennants, cup and handle, and head and shoulders.
By following these steps, traders can enhance their ability to not only identify trends but also make informed decisions on entering and exiting positions based on a comprehensive analysis of the market dynamics.
How to Engage in Trend Trading
Trend trading involves various strategies that, when executed effectively, enable traders to identify trends early and ride them to completion. Here are some key approaches:
Using Technical Indicators
Employing technical indicators is a primary approach in trend-following. These tools, derived from mathematical calculations, aid in identifying trends. Notable trend indicators include moving averages, VWAP, Donchian Channels, Bollinger Bands, and the Average Directional Index (ADX).
Chart and Candlestick Patterns
Another approach revolves around chart and candlestick patterns. These unique patterns assist in recognizing the formation of new trends or the conclusion of existing ones. Reversal candlestick patterns like doji, morning star, evening star, engulfing, and hammer signal potential trend shifts. Meanwhile, chart patterns such as head and shoulders, flags, pennants, triangles, and wedges indicate reversals or continuations.
Trendlines
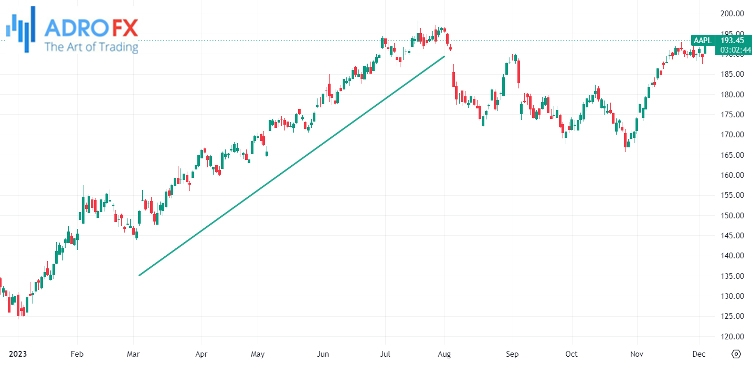
Trendlines are integral to trend trading, involving the drawing of a line connecting key support or resistance levels. When the price remains above the trendline, it signifies a robust trend. Conversely, a break below the trendline suggests an impending end to the existing trend. For example, the chart illustrates Apple shares in an uptrend supported by an ascending trendline.
Pullbacks and Breakouts
Trend trading can also be executed through pullbacks and breakouts. Pullbacks occur when an asset in an uptrend retreats before resuming its bullish momentum. Conversely, breakouts follow a period of consolidation within a tight range or channel. Breakouts often precede new trends and may be identified by chart patterns such as triangles and double-tops.
By incorporating these diverse approaches, traders can enhance their ability to navigate and capitalize on trends, making informed decisions on when to enter or exit positions in dynamic market conditions.
Trend Trading Strategies
Professionals in trend trading employ various strategies to identify and capitalize on emerging trends. The central theme of these approaches involves buying an asset with the anticipation of a continued price rise or shorting an asset expected to decline in the near future. For instance, if a stock is currently valued at $20 and you foresee a drop to $15, initiating a short trade allows you to benefit from the anticipated decline.
Several effective trend trading strategies are outlined below:
- Technical Indicators
Utilizing technical indicators constitutes a popular approach. Employ tools such as moving averages and Bollinger Bands to inform your trading decisions. The objective is to enter a trade as long as the asset remains above the chosen indicator and exit when the trend undergoes a change. - Chart Patterns
Another strategy involves leveraging chart patterns to identify new trends and potential reversals. Prominent chart patterns like head and shoulders and flags serve as reliable indicators. Additionally, incorporating candlestick patterns enhances the ability to recognize emerging trends. - Breakouts
Focusing on breakouts is a proactive strategy where you patiently wait for an asset to move out of a consolidation phase or a chart pattern. The goal is to make your move as the breakout occurs. Technical indicators can also be integrated into this strategy to enhance precision in trading breakouts.
These trend trading strategies provide a comprehensive toolkit for traders, enabling them to navigate the market with a strategic approach. Whether relying on technical indicators, chart patterns, or breakouts, the goal remains consistent: to identify and capitalize on trends from their inception to fruition.
Exit Strategies for Trend Trading
Knowing when to exit a bullish or bearish trade is crucial in trend trading, and various approaches are employed by traders for this purpose.
Oscillator Signals
Traders often exit trades when oscillators like the RSI and Stochastic reach extreme overbought levels. These signals indicate potential exhaustion in the trend, prompting traders to secure gains or cut losses.
Trendline Breaks
Another exit strategy involves observing trendline movements. A break below an ascending trendline signals a potential fade in the bullish trend. Similarly, if the price falls below a trend indicator, it suggests that the trend is concluding.
Chart Pattern Recognition
Identifying emerging chart patterns is a proactive exit strategy. For example, the formation of patterns like double-tops or triple-tops suggests an impending end to the existing trend.
Risk Management in Trend Trading
Effective risk management is integral to successful trend trading, and traders employ various strategies to mitigate risks and maximize returns.
- Trailing Stop Loss
Trailing Stop Loss is a dynamic tool that automatically stops a trade when it reaches a predefined level. Unlike a standard Stop Loss, a trailing stop captures gains in case of a reversal, preventing potential losses as the trade progresses. - Pairs Trading
Pairs trading involves simultaneously trading two correlated or uncorrelated financial assets to offset risk. For instance, buying one stock and shorting another in a correlated sector can capitalize on the spread between the two. - Take Profit
Take Profit orders are set to automatically close a trade when it reaches a specified level. This tool ensures that yield aligns with the trader's strategy. - Manual Exits
Traders may opt for manual exits based on specific chart patterns or candlestick formations indicative of potential trend reversals. Exit points may align with patterns such as head and shoulders, double-top and bottom, wedges, or candlestick patterns like doji, hammer, morning, and evening star. - Position Sizing and Leverage Control
Position sizing involves placing small trades to prevent substantial losses while controlling leverage sizes helps mitigate risks associated with excessive leverage.
By incorporating these exit strategies and risk management approaches, trend traders enhance their ability to navigate the market, protect their capital, and optimize returns in varying market conditions.
Conclusion
Trend trading, a strategy deeply rooted in market dynamics, empowers traders to capitalize on asset price movements. By recognizing trends early and employing effective strategies, traders navigate the complexities of financial markets. Distinguishing between momentum and trend trading provides crucial insights, as does understanding the contrasting approaches of reversal and trend trading. Breakout strategies open doors to new trends, while robust risk management ensures protection against potential downsides. Whether through oscillator signals, trendline breaks, or chart pattern recognition, knowing when to exit a trade is paramount. Equipped with a toolkit of exit strategies and risk management techniques, trend traders optimize their ability to thrive in diverse market conditions, making informed decisions that go beyond mere financial gains.

About AdroFx
Established in 2018, AdroFx is known for its high technology and its ability to deliver high-quality brokerage services in more than 200 countries around the world. AdroFx makes every effort to keep its customers satisfied and to meet all the trading needs of any trader. With the five types of trading accounts, we have all it takes to fit any traders` needs and styles. The company provides access to 115+ trading instruments, including currencies, metals, stocks, and cryptocurrencies, which make it possible to make the most out of trading on the financial markets. Considering all the above, AdroFx is the perfect variant for anyone who doesn't settle for less than the best.
Related Articles


Latest updates
Latest updates


Technical Analysis
Latest updates


