Benefitting from Crossovers: Everything You Need to Know

In the ever-evolving landscape of financial markets, the term "crossover" stands as a key beacon for traders seeking to decipher market trends and capitalize on strategic opportunities. A crossover occurs when two or more indicators intersect, offering valuable insights into potential shifts in an asset's price trajectory. This article delves into the intricacies of crossovers, exploring their significance, application across various timeframes, and the diverse strategies employed by traders. From the simplicity of moving averages to the complexity of oscillators like MACD and Stochastic, we uncover the methods for recognizing crossovers and their role in shaping trading decisions. As we navigate this analytical journey, we aim to equip traders with the knowledge and strategies needed to harness the power of crossovers for successful and resilient trading.
What Is a Crossover?
A crossover, as the term implies, refers to the moment when two or more indicators intersect. This occurrence provides insights into the potential direction of an asset's price movement. Crossovers are instrumental in identifying entry and exit points for trend trades and can signal the likelihood of an impending conclusion to an existing trend. Recognizing these instances is crucial as they serve as valuable indicators for identifying trading opportunities.
Crossovers are observable across various timeframes, catering to the preferences of different types of traders. Day traders typically focus on extremely short timeframes, such as one minute, while swing traders seek medium-term overlaps, and long-term investors analyze more extended movements.
There are two primary types of crossovers: bullish and bearish. A bullish crossover materializes at a lower price point, signaling an imminent upward movement and suggesting a potential shift from a bearish to a bullish market sentiment. Conversely, a bearish crossover occurs when an asset in an uptrend undergoes a change in direction, transitioning to a bearish outlook.
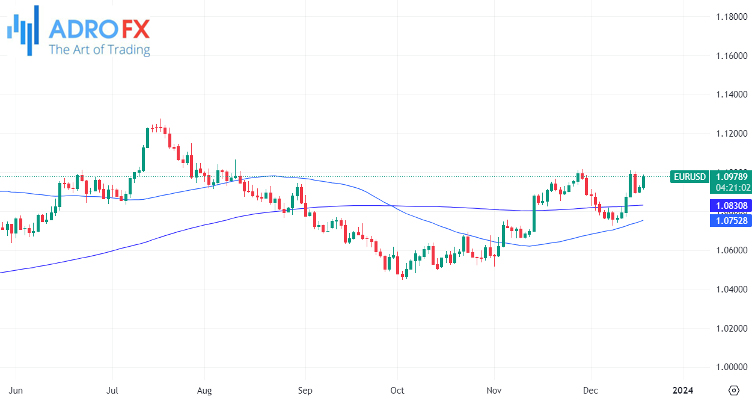
A commonly observed scenario is the crossing of short and long moving averages, which provides a clear illustration of these crossovers.
What Crossovers Mean in the Stock Market
The concept of crossovers is widely employed in technical analysis, particularly in chart analysis. It is frequently applied in conjunction with moving averages, which are among the most popular technical indicators in the financial industry.
In technical analysis, crossovers often indicate the likelihood of an ongoing trend reaching its conclusion and the emergence of a new trend. For instance, if two indicators intersect during a downtrend, it suggests the potential initiation of a new bullish trend.
In essence, crossovers are integral to trading reversals. Following a reversal, a new trend typically unfolds, presenting traders with an opportunity to follow and capitalize on the evolving market dynamics until the trend reaches its conclusion.
Methods for Recognizing Crossovers
-
The Simplified Approach: Utilizing Moving Averages (MAs)
Among the most widely employed techniques for identifying crossovers are the renowned golden cross and death cross. These occurrences transpire when two moving averages intersect, serving as signals to initiate buying or selling actions.
A golden cross materializes when a more extended moving average, often based on a 200-period timeframe, crosses paths with a shorter one. For those new to the concept, a moving average is an indicator that tracks the average price of an asset over a specified period. Various types of moving averages exist, including simple moving averages, exponential moving averages, smoothed moving averages, weighted moving averages, and others.
Moving averages function as trend-based indicators, assisting in recognizing the inception and conclusion of trends. For a more in-depth understanding of early trend identification, refer to this resource.
-
Golden Cross and Death Cross
While multiple methods exist for utilizing moving averages, crossovers stand out as one of the most effective. In this context, the approach involves combining two averages with different durations and pinpointing their intersection.
The golden cross and death cross commonly leverage the 200-day and 50-day moving averages. If these two averages intersect in an upward direction, it typically indicates bullish market sentiment, suggesting that prices will continue to rise. Conversely, a downward breakout signals the commencement of a new downward trend.
While the 200-day and 50-day moving averages are widely adopted, short-term traders often customize their preferred periods. A commonly used combination includes the 14-day and 7-day moving averages.
-
MACD
The moving average convergence and divergence (MACD) stand as an oscillator formed through the integration of moving averages, a creation pioneered by Gerald Appel over four decades ago. Since its inception, the MACD has risen to prominence, becoming one of the most widely used indicators globally.
The MACD is computed by subtracting the 12-day exponential moving average (EMA) from the 26-day EMA. The signal line, a pivotal component of the MACD, represents the 9-day moving average of the MACD line. The accompanying histogram is derived by subtracting the MACD line from the signal line.
While the MACD can be employed to identify overbought and oversold conditions, its most popular application lies in recognizing crossovers between its two key lines. A crossover below the neutral line typically signals an imminent upward price breakout, while a crossover above the neutral line indicates a bearish market sentiment. Although the MACD's foundation rests on the 12-day and 26-day moving averages, traders have the flexibility to tailor these periods to align with their specific trading strategies.
-
Stochastic Oscillator
George Lane introduced the Stochastic oscillator in the 1950s, solidifying its status as one of the market's most well-known oscillators, alongside counterparts like the Relative Strength Index (RSI) and the Relative Vigor Index (RVI).
Calculating the Stochastic oscillator involves determining the %K, obtained by subtracting the lowest low from the current close, dividing it by the range between the lowest low and highest low, and then multiplying the result by 100. The %D is subsequently calculated by finding the 3-day simple moving average of the %K.
Utilizing the Stochastic oscillator is straightforward, with its primary purpose being the identification of overbought and oversold levels. Readings below 25 indicate an oversold market, while those above 75 suggest overbought conditions. The prevalent trading strategy involves observing the crossover between %K and %D.
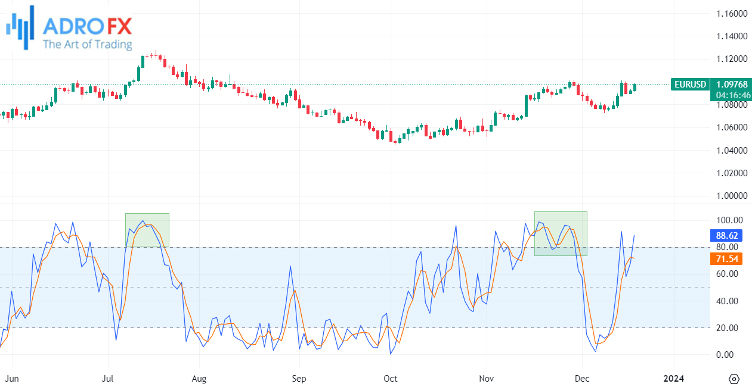
When this crossover occurs in the oversold zone, it often signifies an impending price rebound. Conversely, a crossover above the overbought zone is indicative of an anticipated decline in prices.
Crossover Trading Strategies
Several effective trading strategies can be employed across different trading styles, including day, swing, or position trading, when two indicators intersect. Here are some noteworthy strategies:
Trend Following
Trend following is a strategy that revolves around identifying and following existing trends until they meet a counteracting force.
Crossovers play a pivotal role in trend following. A golden cross often precedes a new bullish trend, providing an opportunity for traders to go long. Conversely, a death cross signals a bearish trend, presenting an opportunity to short the asset.
After a crossover, traders can adopt various approaches to holding the trade, such as staying in as long as the asset remains above the moving average, adhering to an ascending trendline, or maintaining the trade above the dots of the Parabolic SAR.
Check Multiple Time Frames
An additional strategy involves examining crossovers across multiple timeframes to confirm signals. It is generally recommended to use at least three timeframes for analysis.
For day traders, a combination like the four-hour, hourly, and 15-minute charts or the 1-hour, 30-minute, and 5-minute charts can be employed. Confirming crossovers across different timeframes enhances the reliability of the trading signal.
Confirmation Signals
Incorporating crossovers as confirmation signals is another strategic approach, particularly when utilizing price action analysis in conjunction with chart patterns.
Chart patterns like head and shoulders, double-top and triple-top, symmetrical triangles, and wedges can be complemented by crossover patterns like the golden and death cross to validate potential price movements.
These versatile strategies cater to traders with varying preferences and risk appetites, providing a toolbox of approaches to navigate the dynamic landscape of financial markets. Whether aligning with trend following, cross-verifying signals across different timeframes, or using crossovers as confirmation tools, traders can tailor their approach based on their unique trading styles and objectives.

Benefits of Using Crossovers in Trading
There are several advantages to incorporating crossovers into your trading strategy within the financial markets:
- Ease of Use
Crossovers are user-friendly tools, especially when combining short and long-term moving averages or implementing other types of crossovers such as those involving stochastics and MACD. Their simplicity makes them accessible to traders at various skill levels. - Complementary Approach
Crossovers can be effectively used in combination with other indicators. For instance, a convergence of moving averages, stochastics, and MACD can work together to confirm potential reversals, providing a more robust signal for traders. - Customization
Traders have the flexibility to create custom crossover trading strategies tailored to their preferences and objectives. This adaptability allows for a personalized approach that aligns with individual trading styles. - Automation Potential
Crossovers, particularly involving moving averages, can be easily automated using trading robots. This automation enhances efficiency and ensures the timely execution of trading strategies.
Common Crossover Mistakes to Avoid
Despite the benefits, traders should be mindful of common mistakes associated with crossover strategies to prevent substantial losses:
- Over-Reliance on Crossovers
While crossovers are effective, relying solely on them without considering other tools and strategies can be a mistake. A diversified approach enhances the reliability of trading decisions. - Ignoring Market Context
It is crucial to consider broader market factors such as news and economic data in addition to crossovers. Ignoring the overall market context may lead to misinterpretation of signals. - Neglecting Risk Management
Failing to implement proper risk management strategies, such as stop-loss orders, can expose traders to unnecessary risks. Risk management is integral to protecting capital and ensuring sustainable trading.
Risk Management Strategies in Crossover Trading
Effective risk management is essential for successful trading. Here are key risk management strategies when utilizing crossover trading:
- Stop Loss
Utilize Stop Loss orders to automatically exit a trade when it reaches a predetermined price level. Consider using a trailing stop that adjusts with the asset's price movement to protect initial profits. - Position Sizing
Determine an appropriate trade size to manage risk exposure. While larger trades can yield higher profits, they also pose greater potential losses. Opt for moderate trade sizes to strike a balance. - Leverage Control
Exercise caution with leverage, as higher leverage amplifies profits but also increases risk. Limiting leverage reduces potential losses, contributing to a more sustainable trading approach. - Backtesting
Conduct backtesting using historical data to evaluate the performance of a trading strategy, especially if employing a robot or algorithmic tool. This helps gauge the strategy's effectiveness before applying it in live markets.
Other risk management considerations include avoiding overnight trades, cutting losses early, and diversifying investments to spread risk across different assets. A comprehensive risk management plan safeguards traders against unforeseen market fluctuations and supports consistent, long-term success.
Conclusion
In a nutshell, the journey through the world of crossovers unveils a spectrum of tools and strategies that empower traders in their pursuit of market mastery. The benefits of incorporating crossovers into trading strategies are evident, from their user-friendly nature to their compatibility with other indicators and potential for customization and automation. However, it is crucial for traders to tread carefully, avoiding common pitfalls like over-reliance on crossovers and neglecting the broader market context. The risk management strategies highlighted, including the use of Stop Loss orders, prudent position sizing, and leverage control, underscore the importance of safeguarding capital in the face of market uncertainties. As traders venture into the dynamic realm of crossovers, a comprehensive understanding, coupled with strategic acumen and disciplined risk management, paves the way for resilient and successful trading journeys.

About AdroFx
Established in 2018, AdroFx is known for its high technology and its ability to deliver high-quality brokerage services in more than 200 countries around the world. AdroFx makes every effort to keep its customers satisfied and to meet all the trading needs of any trader. With the five types of trading accounts, we have all it takes to fit any traders` needs and styles. The company provides access to 115+ trading instruments, including currencies, metals, stocks, and cryptocurrencies, which make it possible to make the most out of trading on the financial markets. Considering all the above, AdroFx is the perfect variant for anyone who doesn't settle for less than the best.
Related Articles


Latest updates
Latest updates


Technical Analysis
Latest updates


