The Complete Guide to Volatility Indicators
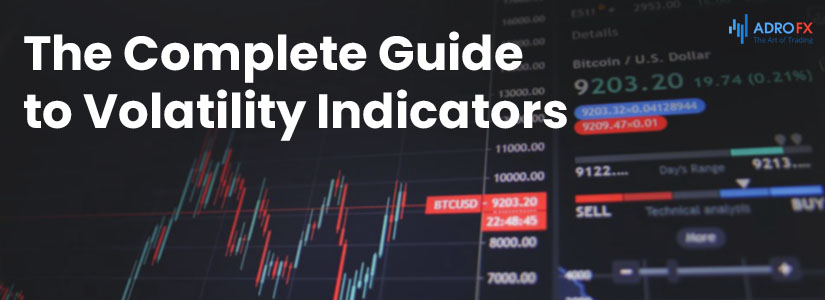
When analyzing the market, traders, especially beginners, often underestimate market volatility. Usually, we are interested in market entry and exit, but we forget that these parameters largely depend on the market volatility. Unfortunately, it is difficult to estimate this important parameter beforehand. And that is where volatility indicators come in to help traders. Today we will discuss the most effective ones.
What is Volatility
Trading without indicators is popular among traders today. And yet, even many supporters of price movement analysis use some kind of volatility indicators to analyze charts and choose the time for trades. This parameter is most often provided by a technical indicator.
There are many definitions of volatility. The simplest definition of the volatility of a currency is the range of its rate change, the difference between the maximum and minimum rate for a given period. The wider the range, the greater the difference, and the more volatile the currency pair is. In more general terms, volatility can be defined as the variability of the exchange rate, expected or realized (past). There are quite a few indicators with their own formulas for calculating the exact value of volatility.
Volatility is an important factor when developing a forex trading strategy because it assesses the ability of a currency rate to change and the opportunity to earn when it does (unless you are trading options).
It is also important not to confuse the volatility of the asset price (currency pair rate) with the volatility of the return (return on investment). In this guide, we will only discuss the former. Although the latter is also very important, it should be studied along with general issues of capital management in forex.
The maximum volatility is observed at the time when most of the players are trading, i.e. during the European and American exchanges. The most popular pairs at this time show the maximum movement. It is desirable to operate during the trading hours on the European and U.S. markets.
It is possible to identify the periods of high and low volatility on the chart of any currency pair. When the market is calm, the potential for trades decreases, instead of, for example, 70-90 points on a trade, you can take only 20-40 points, and not always, and the Stop Loss is also decreased. There is even a separate term "volatility risk" - the probability to suffer losses in open trade, as a result of a strong movement.
As examples of pairs with high volatility, we can name GBP/JPY, and EUR/JPY - it is not a problem for them to pass 150-200 pips per day.
Why Volatility Is So Important
It is most important to pay attention to this indicator when trading in the forex market. As a result of significant events in the economy, sharp price fluctuations of currency pairs occur. Traders who prefer long-term strategies are wary of opening trades with assets with high volatility. At the same time, such unstable periods (intraday volatility) are of interest to traders who prefer short-term trading, and who expect to benefit from price fluctuations.
There are many reasons to measure market volatility. In periods of strong volatility, markets experience powerful movements, so long-term, conservative investors prefer to wait out such a period and not enter the market. Short-term players, especially scalpers, prefer to use such movements to their advantage and try to find interesting points of entry into the market. If they succeed, their returns will be very impressive for a minimum period of time.
In addition, some experienced traders use volatility as a kind of a switch between several strategies, each of which is adapted to a different type of market. There are basic indicators in the MT4 trading terminal to help determine volatility. In addition, you can find several dozen less common indicators on the profile sites, which will help to display the level of volatility.
Let us have a look at the basic volatility indicators showing the volatility of the asset price.
Average True Range (ATR)
Specifically, this indicator is most often used by traders in their work, it appeared almost 40 years ago. In 1978 you can find the first mention of the ATR in Welles Wilder's book. The development has been so popular that this indicator is integrated into almost all modern trading terminals.
ATR is used in many other volatility indicators.
")
On the chart in MT4, it is displayed in a separate window. The wavy line shows the range averaged over a certain number of candles. It can be used:
- To assess the state of the market - the higher the ATR value, the higher the volatility. During a pronounced trend, the line rises quickly. The higher the value of ATR, the higher the probability of reversal. The growing ATR indicates a trend, if you prefer to trade in the direction of the formed trend, take it into account.
- To set a Stop Loss;
- As a filter. The threshold value of volatility is set, if the ATR value is lower, you should not trade. Such filters are often used in trend trading strategies when high volatility is important.
As the basis of a trading strategy, the indicator is rarely used, much more often - as a filter.
The ATR indicator can be used to understand - if it is worth entering the market at this moment or if it is better to postpone entering the market. It is usually used when trading in trend strategies when you want to assess the strength of the volatility of prices in the market.
For example, if the ATR values are low, it indicates low price volatility. Consequently, a flat or consolidation should be observed on the chart. If the ATR is high, then this is a sign of a clear trend. According to a similar scheme, you can estimate the strength of the trend. If the ATR is growing, then the trend on the chart is increasing. If the ATR value decreases, the trend begins to fade.
The indicator is included in the standard set of terminal tools, so you do not need to download and install it separately. To add ATR to the chart, open the "Insert" menu, go to the "Indicators" tab, then to the "Oscillators" tab. In the list that appears, find the Average True Range tool and activate it by left-clicking.
Although the ATR indicator is the main tool for determining the volatility of the price, there are other effective algorithms besides it. For example, you can use a standard trend indicator, which will also show the degree of market volatility and give a signal about the development of a new trend or the fading of the current trend.
Bollinger Bands®
Bollinger Bands® is a trading indicator, which displays measured volatility by tapering around a financial instrument if volatility is low and widening if it is high. Visually, Bollinger Bands® surround a financial instrument with an upper and lower band with a 21-day Moving Average (the preferred time period) between the two bands. Bollinger Bands® can also serve as an indicator of overbought (tighter) and oversold (wider) areas.

Bollinger Band® Signals:
The tighter the bands, the more likely it is that the financial instrument will make a significant move up or down shortly.
The wider the bands, the less likely it is that the financial instrument will change significantly up or down shortly.
Both Bollinger Band® volatility indicators, narrow and wide, can be seen as counter-indicators because of the use of current market conditions to indicate another future market movement.
This forex volatility indicator is reliable and effective due to its dynamism. It makes it possible to analyze the market, plan when to open a trade, and competently determine minimum and maximum price values.
What Bollinger Bands® information provides:
- Volatility. In fact, the main function of the indicator is to determine volatility. When bands widen - we see high volatility, when they contract - low volatility;
- Trend. Since the basis of this indicator is a Moving Average (MA), it is logical to consider it as a trend indicator. It allows us to understand and detect a trend movement;
- "High" or "Low" prices. Price moves out of range of the line - it may indicate high or low price for the asset, oversold or overbought areas;
- Patterns. W and M patterns can be identified more easily with the help of the indicator;
It is important to understand that the Bollinger Bands ® are best used in conjunction with other indicators. With other indicators, this tool gives more accurate signals and a better understanding of the market situation.
Relative Vigor Index (RVI) Indicator
The RVI indicator is an oscillator, which shows the energy of the current price movement and reflects the confidence of the price movement from the opening price to the closing price in the range of maximum and minimum prices of the price period. This, in turn, gives the trader an idea of whether the further movement is more or less likely to continue.

The Relative Vigor Index, unlike classical oscillators, does not have overbought and oversold areas and gives trading signals by crossing the RVI line and the signal line. If the RVI line (red, faster one) crosses the signal line (green, smoother one) from the top downwards, then on the opening of the next candle a long position should be placed with a Stop Loss set behind the last extremum. The position is held until the opposite crossover of RVI lines and the signal line, where the current position is closed by Take Profit and the opposite one is opened by a mirror with the same principle.
RVI can have both positive and negative values. Therefore, it is considered that if both indicator lines are above zero and the RVI line is above the signal line, the market is more inclined to buy than to sell, and if both indicator lines are below zero and the RVI line is below the signal line, the market is more inclined to sell.
The RVI indicator gives the most powerful signal when there is a divergence with the price. Thus, if the price during the trend updates its extremum, which does not happen according to the indicator, - then the trend is ready to reverse, as it is not supported by professionals and continues to move by inertia. In this case, the trade is placed at the opening of the next candle after crossing the RVI lines and the signal line by setting a Stop Loss for the price extremum.
Chaikin Volatility Indicator
The difference between maximum and minimum values of periods is taken as a price range in this indicator. This indicator is based on the assumption that volatility increases sharply at the beginning of a trend and decreases during correction and trend fading.

Based on the fact that the downtrend begins and ends with the increase in volatility, it is advisable to place orders when after the flat (especially continuous) Chaikin's Volatility has sharply increased, indicating the beginning of a trend. The Stop should be placed behind the last local extremum. The gain should be secured at the moment of the new growth of volatility (especially for the downtrend), or its decrease (for the growing trend, although its completion can be marked by the growth of the indicator).
Based on that Chaikin's Volatility essentially shows the growth of volatility of trend borders, it can be combined with other indicators (Chaikin himself recommended such usage). For example, one can use Chaikin's Volatility in pair with a Moving Average in case Chaikin's Volatility rises sharply after a sideways move and then open additional positions if the price touches the EMA and moves in the direction of the trend. The Stop Loss should be set behind the last local extremum.
Commodity Channel Index (CCI) Indicator
This indicator of daily volatility was developed by D. Lambert. He intended it for technical analysis of the commodity market, but later it was used in other markets, after which it became very popular. It shows the divergence of the trading instrument price from its average value.

Lambert originally created this indicator to find the beginning and the end of supposed seasonal cyclical price patterns. He believed that instrument price fluctuations between the +100 and -100 lines are random and have no value for trading. He suggested opening long positions only when the indicator goes above the +100 level. A significant drop below the +100 line, such as below the zero line, is considered a signal to exit a long position. Conversely, the rules for opening a short position suggest opening a short when the indicator falls below the -100 level and closing when it rises well above -100, crossing the zero line.
Even though the developer of the indicator saw it as a tool to identify a strong trend, currently, in many trading platforms, this indicator is represented by the oscillator, which serves to determine the overbought or oversold levels. In this regard, the interpretation of signals to open and close a position is determined quite differently. In this case, when the indicator appears above the +100 level, the market is overbought, and therefore the probability of a downward reversal increases. Therefore, as soon as the indicator falls and crosses the line of +100 downwards, a signal to open a short position occurs. If the CCI indicator falls below the -100 line, then the market is oversold. Therefore, as soon as the indicator crosses the -100 line from the bottom upwards, it is necessary to close the short position and open a long one.
To the above types of interpretation of the signals, you can add another trend-following signal to open and close a position when the zero line is crossed. In this case (when the indicator crosses the zero line upwards) you need to open a long position, and when it crosses the zero line downwards it is necessary to close a long position and open a short one.
RSI Oscillator
The RSI indicator, invented by American Welles Wilder in the late 70s, is quite interesting in terms of detecting market volatility. Its task is to measure downward and upward movements, and then calculate the average value for these periods and divide the positive values of this average by the sum of the negative periods.

Unlike other oscillators, the RSI indicator can be an early signal informing us of a possible price reversal point or level. We read the RSI signals according to the standard readings of the oscillator itself. If the price exceeds the standard values of the indicator, that is, 30 or 70, this is information about oversold or overbought areas. Subsequently, when the price returns to the channel between these values, the next slope is formed. So, here we are dealing with a signal which allows us to recognize key lows and highs relatively early.
However, for this indicator to do its job, you need to learn how to use it individually. It may turn out to be much better to trade in open trade, change positions and play on slopes opposite to the trend. Here it all depends on personal preferences, investment style, and your own experience.
Keltner Channels Indicator
The indicator was created in 1960 by C. Keltner. Named after its creator, the tool shows a channel on the chart, within which the price moves. The appearance of the indicator is very similar to the Bollinger Bands® and also consists of three Moving Averages.

The Keltner Channels and Bollinger Bands® differ from each other by the algorithms for calculating the curved lines, which are the boundaries of the channel. The Keltner indicator is less sensitive to market changes and gives smoother readings. Therefore, its signals are much more accurate but come much less frequently.
The strength of the market volatility according to Keltner is defined in the same way as according to Bollinger Bands®. The wider the channel, the stronger the volatility. A narrow channel indicates that the market is going flat. The direction of the channel borders indicates the chart trend. For example, if the lines are going upwards, this trend is bullish, and if they are going downwards, this trend is bearish.
Can I Make Succeed Using Only The Volatility Indicator
It should be remembered that there is no perfect technical analysis tool. At the same time, using them in trading, you can insure against unreasonable risks. They also help to determine the best moment to open a trade. These factors help to increase the likelihood that the trade will be successful .
There are a lot of indicators in the forex market which allow you to evaluate the price volatility. It is enough to use several of them for effective trading. If you apply the indicators described above in your work, it will significantly increase the chances of generating a return. It will also help to minimize all the risks.
However, all of these technical tools are auxiliary. There is no concept of the best indicator in the currency market. It is necessary to use the fundamental analysis to trade effectively and to get serious gain. It studies the factors, which create the price movement. These include the sentiment of the market, cash flow, supply and demand analysis, the interaction of markets with each other, and many others.
Top Tips For Managing Volatility
With the onset of the crisis, we are witnessing significant unpredictability and volatility in the markets. High volatility in the forex market contributes to faster significant earnings but also increases the risk of losing some or even all of your invested capital. Here we will share effective tips on how to trade safely and wisely during periods of high volatility.
Understand the psychology of trading
For successful trading in volatile markets, you need a basic understanding of trading psychology. When market price fluctuations are larger than usual, increased volatility can trigger some emotions, and the trader himself can be overcome by fear or greed. Volatility intensifies these emotions, which has a significant impact on an investor's interpretation of the situation, clouding judgment and leading to irrational decisions. The best way to deal with your emotions is to clearly follow a proven trading strategy, as it requires discipline.
Decide on your trading tactics
Choosing the best strategy often depends on determining whether the market in question is in an uptrend, downtrend, or sideways trend. In the case of a sideways market, narrow Stop Losses can cost us dearly because of strong price swings. In the case of an uptrend or downtrend, we open positions according to the trend. By using smart Stop Loss and Take Profit levels, you can increase your chances of success in volatile markets.
Create your own strategy
Your trading strategy should include:
- Instructions on entry and exit points into the market,
- Strict risk management rules,
- Stop Loss and Take Profit levels.
Cutting your losses without delay is the key to surviving in extremely volatile markets. If you don't, you can quickly increase your losses in a very short time. By taking a small loss before it gets big, you can save your capital and invest it at the next opportunity. Take Profit levels should also remain adapted to market conditions and can sometimes be increased to take advantage of increased price fluctuations to make substantial returns. It is also crucial to spread risk by opening smaller positions and diversifying by trading different financial instruments (CFDs on stocks, metals, ETFs, etc.).
Tighten your Stop Loss rules
In times of market volatility, it is advisable to tighten your Stop Loss rules to reduce the risk of high price volatility. High price volatility often occurs in high-risk currency pairs (JPY/USD, XAU/USD, etc.) and commodities and can lead to a series of losses that accumulate quickly. Some investors also suggest that delaying Stop Loss/Take Profit levels can increase the likelihood of staying in the market, but this is associated with an increase in the deposit.
Reduce your exposure to risk
Forex market volatility is largely due to the use of high leverage to open positions. In an extremely volatile market, you may need to reduce your risk exposure and use less leverage. Understanding how to use leverage and reduce trading volume are additional ways to reduce risk in volatile markets.
Understand the market
Knowing the key factors that influence market volatility:
- Economic news,
- Geopolitical events,
- Central bank policies and activities,
- Technical analysis and related tools,
- Market sentiment and even market rumors.
All those can help you determine how long market volatility will last, how wide exchange rate swings can be, and how much risk is worth at any given time.
Stand back and wait for the next opportunity
Standing aside also means taking a position. Sometimes it is better to get out of the market and wait for the next investment opportunity. Maintaining discipline is the key to surviving in a highly volatile market.
Conclusion
Information on volatility allows you to assess the state of the market (not only forex but also the stock market). If a trader's activity is high, the probability of strong movements increases. In most cases, a trader learns about volatility in real-time. Predicting future volatility is quite difficult and requires the use of fairly complex models. Therefore, apart from volatility, we recommend using additional tools for technical analysis and following the above-mentioned rules for successful trading in volatile markets.
Related Articles


Latest updates
Latest updates


Technical Analysis
Latest updates


