How to Use Volume in Technical Analysis to Improve Your Trading
Most traders know that the methods of technical analysis are based on the study of changes in the movements of price charts and the Market Depth. However, another important object of technical analysis is trading volumes.
Experienced traders believe that there are two objective factors in the market: the price and volumes.
Let's see in more detail what a trading volume is, how to analyze it, and which tools for its evaluation are available to a modern trader.
What Is a Trading Volume
Trading volume is usually understood as the quantity of all transactions made on the market in a certain period.
Thus, it is quite possible to find out the trading volume at any stock exchange. This data is often published in the open access in various screeners.
At the same time, there is no direct information about the volume of currency trading on the market even now. This is a market, not an exchange, so there is no one to count financial operations with currency.
Against this statement one often hears the question: What about currency exchanges, don't they provide such data?
The fact is that the abandonment of the gold standard and economic globalization led to the replacement of currency exchanges by a round-the-clock and global currency market.
Today the place of currency exchanges is divided between forex and futures exchanges. The latter are trading platforms, where currency futures and options are traded, but not the currency itself.
That is why the real volume of currency market trading is not officially counted by anyone even today. However, the information about the number of transactions, provided by the currency exchanges is quite up to date.
You have to be very careful when calculating trading volumes on your own. For example, when calculating the volume on your account, it is necessary to consider that one closed order will include at least two completed deals. The long position opening means the asset purchase, and the closing means its sale. Thus, a closed Buy order will include a buy deal and a sell deal.
If the trader opened a short position of 50 shares at the beginning of the trading day, and closed it at the end, their trading volume for the session will be 100 shares.
Note that in the first example, we expressed the trading volume in the number of trades (a closed order has at least two trades), and in the second one in the number of shares. It is generally accepted that the opening of a position for the purchase of a lot of 10 shares is equivalent to the conclusion of 10 contracts for the purchase of a security. Therefore, there is no difference in what the trading volume is expressed (in shares, transactions, or contracts), its numerical value in any of the above cases remains the same.
A rather rare method of trading volume calculation is its expression in the number of lots and, even more seldom, in money equivalent.
The main grounds for more or less objective counting of trades are stock and futures markets. With the development of computer technologies, the method of calculating the trading volume by ticks has become widespread. Even though such calculation data cannot be considered as the exchange's official information, as a rule, the values are very close.
Considering all features considered above, it is possible to formulate two rather precise definitions:
- Trading volume is the number of all transactions (contracts) made on the market during a certain trading period;
- Trading volume is a quantity of shares (futures), which changed ownership in a certain trading period.
These rather different definitions fully reflect the essence of the trading volume.
How to Use Volume to Analyze Price Movements
Modern traders have begun to pay more attention to the estimation of trading volumes. Technical analysis tools and special indicators are often used for their analysis.
Wall Street legend Joseph Granville compared trading volumes to steam pushing a value steam train.
Market analysis using volumes is based on the application of previously identified patterns in the relationship between price movements and changes in the number of trades.
As a rule, volumes are not used as an independent tool, but as confirmation of other signals, trend strength, or different patterns.
Regardless of the direction of the price movement, if the volumes are large, such movement will have a significant force and most likely, will keep its direction. Small trading volumes indicate a weak price movement – the risk of price reversal.
Thus investors often resort to checking the credibility of sharp price impulses by checking the charts of trading volumes against the price charts.
Here is an example: After a week-long downward movement, the stock price spiked 7% in one trading session. It is logical to ask: Was there a trend reversal, or is it just a correction? A sign that the trend is holding is whether the trading volume is holding or slightly changing. If the volume of trading in shares has increased significantly, it will be a sure sign of a change in the price direction.
Mutual change in the volume and price of a trading asset can be characterized by convergence and divergence.
Quite effective is the usage of the trading turnover volumes for confirmation of the support and resistance levels breakouts. As in the case with the trend check, an increase in volume indicates an increase in the strength of the price movement - the credibility of the breakout, while a decrease in volume makes the breakout unlikely.
Some traders use trading volume analysis with support/resistance levels quite effectively in searching for trading entry/exit points.
Another way to use volumes is to confirm candlestick patterns and technical analysis patterns (head and shoulders, triangles, flag, hanging man, etc.).
Because each pattern has its "key points", the comparison of price movements in these points with the trading volume can confirm or refute the pattern signal.
It is necessary to note that in the technical analysis, the volumes give the anticipatory signals, and this advantageously distinguishes them from other means.
Volume Indicators
The development of information technology has greatly expanded the possibilities of technical analysis and made it available to a wide range of traders. The trading volume analysis has not become an exception.
For instance, the possibility of tickwise calculation of volume on the forex market has appeared. Understandable graphical ways of presenting data on volumes began to be developed.
Nowadays, there are many indicators, which help to visualize the quantitative data of performed operations.
Trading volume indicators are present in most trading terminals. They can be classified by several criteria.
- Horizontal volume - displayed as a histogram with horizontal bars, superimposed directly on the price chart. It detects important price levels in which large investors are interested;
- Vertical volume - represented by a bar chart with vertical bars. As a rule, it is placed under the price chart, one candle corresponds to one bar in the histogram. This way of displaying data does not provide information about the changes in the trading volume within the candlestick and does not identify price levels.
Indicators of vertical and horizontal volumes can be used separately or together. However, it should be noted that MetaTrader has no built-in horizontal volumes indicator, and investors will need to find the tool from a third-party developer.
Another criterion for dividing the trading volume indicators is the source of received data.
All volume indicators in MetaTrader 4 are tick indicators. The value of one bar of the trading volume informs about the amount of price changes in the corresponding candle of the price chart.
Tick charts are not data from a real source (stock exchange), but traders successfully use them in trading. If we compare the histograms of real volumes from the exchange and calculated by ticks in the terminal, their outlines will be very similar.
Top Volume Indicators For MetaTrader 4
We have to say that MetaTrader 4 pays little attention to algorithms of this type. The terminal has only 4 vertical volume indicators, and there are no horizontal volumes and levels. Still, numerous custom indicators can be easily installed on the platform.
Let's consider the most common indicators of trading volumes.
Volumes
This is a standard MetaTrader 4 indicator. The tool is configured by the developers by default and it is not possible to adjust its parameters.
From the visualization settings, only the color options of the bars and the size of the histogram itself are available. The indicator is placed under the price chart. Each candlestick corresponds to a histogram column.
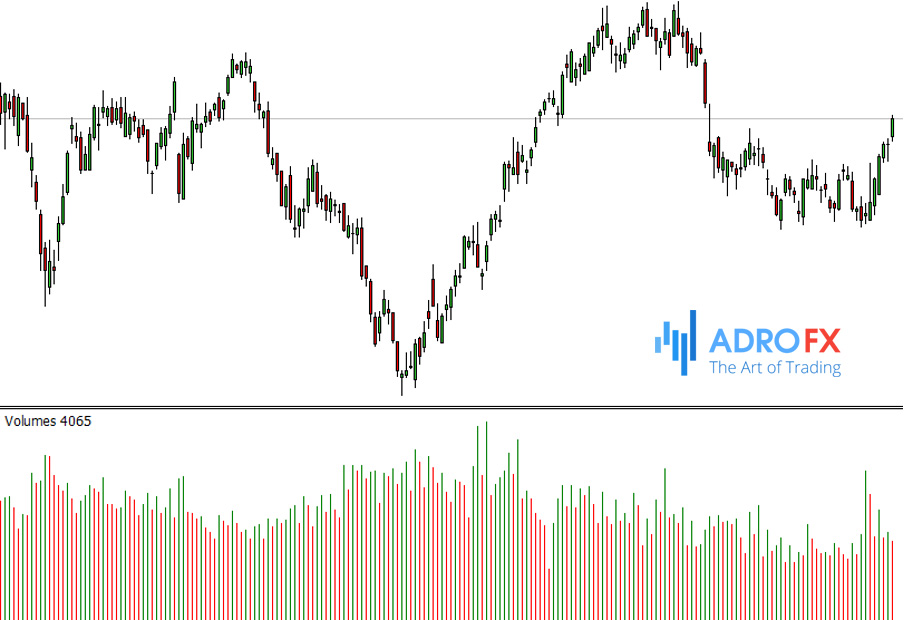
The height of the bar indicates the number of trades performed during the formation of the candle, the higher it is, the more trades are performed. By default, the red color of the bar indicates that sales prevailed among all trades, green - purchases.
VWAP
This one is not really an indicator of the number of transactions in the market. It is a Moving Average, the calculation of which includes an indicator of the trading volume.
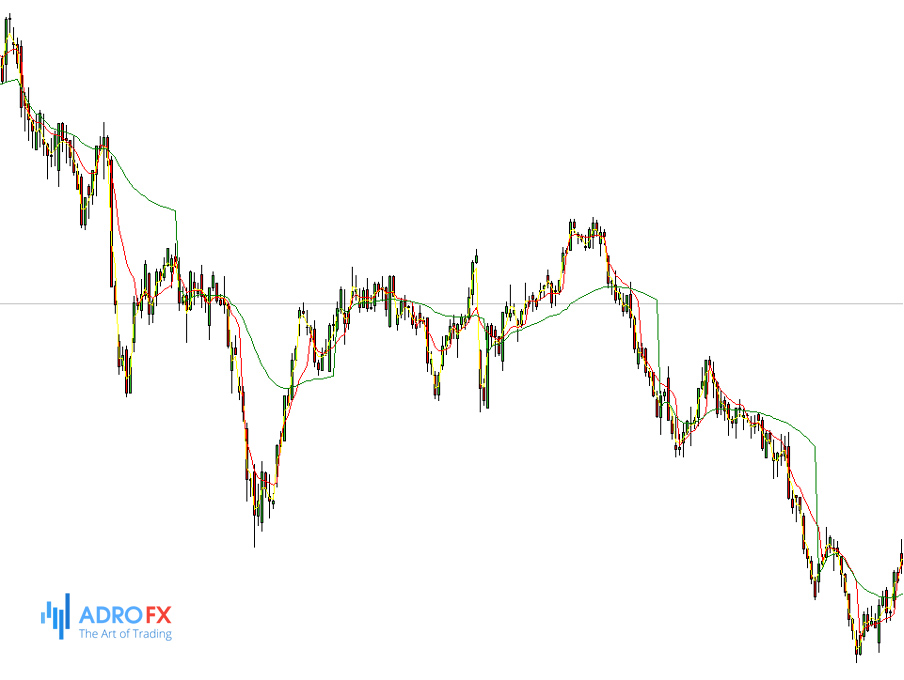
The price and the number of trades at each candle in the selected time frame are multiplied and then divided by the total volume of transactions for the selected period. The indicator can become an alternative to the Bollinger Bands. The main indicator signal is the price rebound from the signal levels.
This custom indicator can be downloaded free of charge for the MetaTrader 4 platform.
High Volume Bars
This indicator plots horizontal volume histograms on daily periods. The largest bars of the indicator are important levels of the trading period.
Level Sensor
It is also an indicator of vertical volumes. It is displayed in the left margin along the whole length of the window, thus it shows the pro-trading on the whole chart.

It allows identifying crucial trading levels and has proven itself in trend strategies.
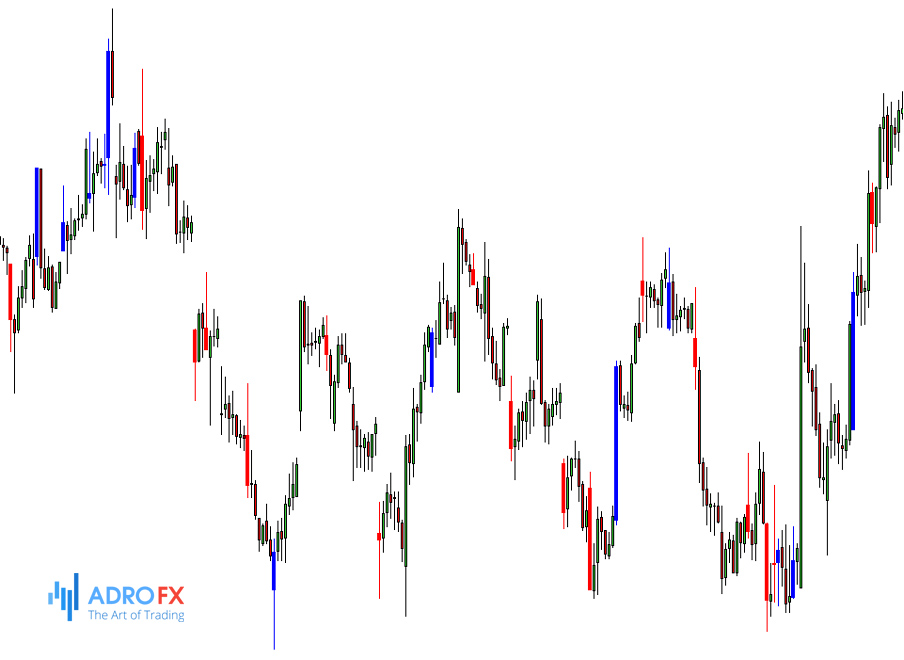
Market Profile Trend Lines
This indicator is built by days. In addition to building daily horizontal histograms, this algorithm has additional features. On the price, the chart marked control points (Point of control - POC), which characterize the largest trading volumes.
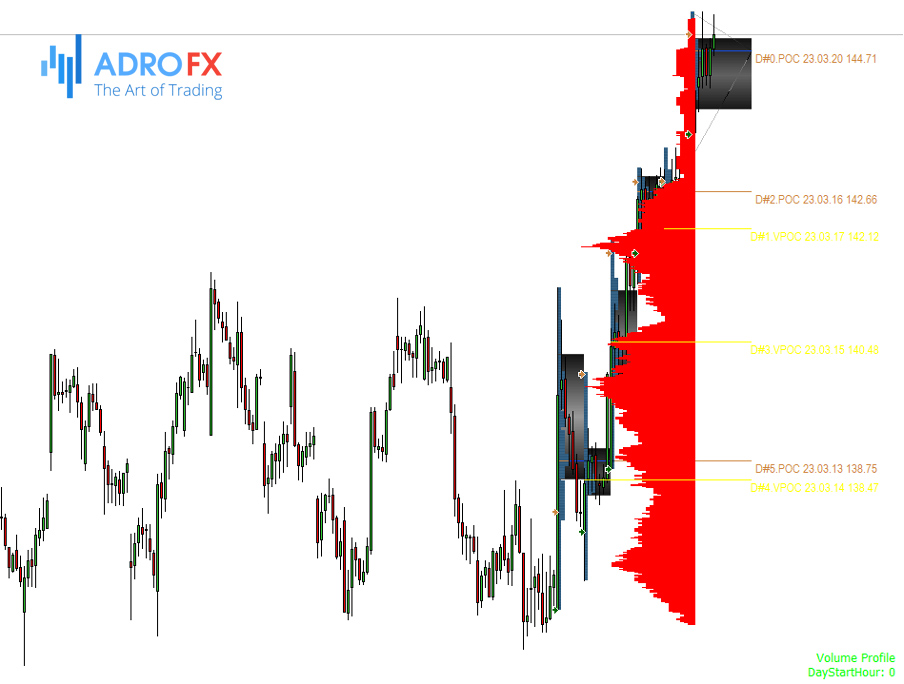
The indicator also automatically draws trend lines, but their objectivity is rather questionable.
However, the main value in working with any indicator for displaying volumes will be the ability to use them correctly.
Tips For Using Trading Volume
As mentioned earlier, all volume indicators are quite similar to each other. The key factor in their successful use is the trader's experience and ability to work with this tool for market analysis.
When applying volume indicators, you should be guided by the following rules:
Use an indicator as an auxiliary tool (confirming a signal received earlier);
Take into consideration that trading volumes give leading signals;
It is possible to master the technique of trading with volumes by using the free analysis tools integrated into the terminal;
It is advised to trade following the trend, i.e. to open trades only upon histogram signals that coincide with the trend direction in a higher time frame.
Conclusion
The ability to use trading volume indicators will be a good help to any trader. Volumes can be complemented by other indicators in almost any trading system.
An important factor when using volumes is the ability of a trader to correctly interpret the received signals. And most importantly - volume is one of the few indicators that can really anticipate price movements. So, be sure to take advantage of this advantageous property of trading volumes.
Related Articles
Latest updates
Latest updates


Technical Analysis
Latest updates


