Market Sentiment Indicators And Application And How To Trade It
Virtually every trader is constantly on the lookout for something that would give an extra edge in the market or a new opportunity to outbid that market. The search can consist of a careful analysis of price charts and the financial condition of a company. Traders and investors are trying to find some elusive thing that is not available to other market participants and which would be their Grail of successful trading.
But the price charts and financials themselves are only part of something bigger. These data and indicators, thanks to the efforts of millions of traders, are subjected to a variety of analyses. And in the end, despite the sameness of this data, everyone gets a different result and interpretation. In this case, the approach and the result vary from instrument to instrument, from market to market. The application of the technical and fundamental analysis is not bad in itself, but it looks like a two-legged stool, which is not a very stable object.
So what are traders and investors missing? The sentiment of market participants. To be more precise, the collective mood of the players. If you use fundamental, technical, and sentiment analysis together, you can get a clearer picture of what is going on in the market.
Identify Market Indicators
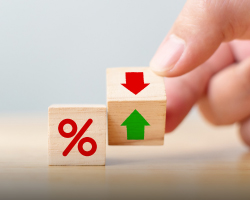
From the technical perspective, the sentiment is determined by the number of open positions. If exchange members predominantly open long positions, we should talk about bullish sentiment and a possible rise in the price of the underlying asset.
If most trades are opened for sale, it is a bearish attitude and a decrease of the exchange value of the tradable instrument should be expected.
But how do you identify the market sentiment? It's complicated. How to measure something that is strictly related to psychology? In the financial markets, everyone has an opinion, and everyone is looking for an advantage. However, there are several indicators that are based on surveys among market participants that can help us with the identification of market sentiment. Keep reading to find out.
Market Sentiment Formation
Basically, market sentiment is mainly influenced by different fundamental aspects. These involve multiple financial, economic, and political situations which directly influence currency prices. The before-mentioned factors are analyzed by fundamental analysis. Hither is the most significant of these factors:
● Monetary policy of central banks: cycles of raising and lowering of the principal interest rate may bring long-term upward and downward trends in the national currency. If market participants expect a rate hike, market sentiment will be upbeat: market participants will be willing to buy. If interest rates are expected to fall, it will be the other way around.
● Economic factors: if the report about a country's economy is positive (GDP, employment, production, etc.), market sentiment about the currency will improve.
● Political factors: elections, government resignation, scandals, sanctions, etc. Political factors: elections, government resignation, scandals, sanctions, etc., can shape the market's negative attitude to a currency.
● Rumors: those entail political and economic factors but in the form of suggestions and expectations.
● Force majeure: natural disasters, man-made disasters, terrorist attacks, epidemics. All of these can form a seriously negative attitude to the currency.
The impact of fundamental aspects on the sentiment of the markets can be short-term (from some minutes to a couple of days) or long-term (several weeks, months, years). For instance, information about unemployment growth last month may have had a short-term negative effect on market sentiment, while the statement of the head of the Central Bank about the need to raise interest rates may form a long-term positive attitude towards the currency.
Advance/Decline Ratio
The advance/decline ratio (A/D Ratio) shows the ratio between the stocks that rose and fell in price and is calculated by dividing the number of the former by the number of the latter.
The A/D Ratio is similar to the difference between rising and falling stocks. Both are measures of market breadth. But the difference indicator is the difference between the number of rising and falling stocks, while the A/D ratio is their ratio. The advantage of the coefficient is that it remains constant, regardless of the number of shares traded on the New York Stock Exchange (it is constantly increasing).
Often the moving average of the A/D ratio is used as an indicator of an overbought/oversold market. The higher it is, the more "excessive" is price growth and the more likely is a corrective decline. By analogy, low values of the moving average indicate that the market is oversold and a technical rise is likely.
However, you should keep in mind that a market that appears to be heavily overbought or oversold can remain so for quite a long time. Therefore, before acting on the signals of overbought/oversold indicators, it is wise to wait for the prices themselves to confirm your forecast of upcoming changes.
Fluctuations of daily A/D ratios are usually smoothed out by means of a moving average.
New High/New Low Ratio

New High/New Low Ratio is a market breadth indicator that measures the strength or weakness of a particular asset. It is calculated by dividing new highs by the sum of new highs and new lows, multiplying by 100, and then applying the 10-day Simple Moving Average (SMA) of that series to smooth out the values. When the index is above its own midpoint (50), that means more new highs than lows, and when it is below 50, more lows than highs. Values above 70 or below 30 indicate strong uptrends and strong downtrends respectively. The indicator is best used in combination with other analysis methods.
Accumulation/Distribution Line
The accumulation/distribution line is a complex technical indicator, which is based on trading volume; it helps to confirm or refute the strength of the current trend.
It is one of the few indicators in technical analysis, which is based on trading volume. By its nature, the accumulation/distribution line is very similar to the balance volume, but it has some important differences. The main hypothesis, on which the accumulation/distribution line and the balance volume are based, says that the volume leads the price and that the direction of price movement can be predicted by changes in the trading volume.

The accumulation/distribution line, unlike the balance volume, is not so easy to calculate and is based on another principle than the balance volume. Whereas the balance volume is based on the difference of closing prices of the current and previous periods (days, weeks, etc.), the accumulation/distribution line is based on the data within one period and is range-based (i.e. the absolute value between the maximum and minimum).
The accumulation/distribution line as an analytical and forecasting tool of stock (or another financial instrument) movement direction has two functions:
- to confirm the current trend;
- to disprove and question the current trend.
If the indicator direction of movement corresponds to the price direction, the current trend is confirmed, and the accumulation/distribution line tells us that the current trend is strong enough.
And if you observe the divergence between the direction of the accumulation/distribution line and the direction of the price movement, then be alert and get ready for the turn of the price in the direction of the indicator movement.
CBOE Volatility – The VIX Index
The Volatility Index (VIX) is an index calculated since 1993 by the Chicago Board Options Exchange and is an indicator of expectations of market volatility. The VIX, also called the "fear index," reflects market expectations (sentiment, pulse) rather than exactly what is going to happen.
The value of the Volatility Index is a generalized guess, based on the price of the premiums investors are willing to pay for the right to buy or sell an option on the S&P 500 Index. Thus, VIX is a weighted average of all option prices of the S&P 500 index.

The value of the volatility index is measured as a percentage and is approximated by the movement expected in the S&P 500 Index over the next 30 calendar days, then recalculated to a year. For example, if the value of VIX is 15, this represents 15% of the expected annual change.
The VIX has an inverse relationship to stock markets. The volatility index will rise in value when the stock market (primarily the S&P index) falls.
When the VIX rises above 40-45, it indicates that the fear level in the market is rising and investors are running away from risk.
If the value is near or below 17, it is an indicator of quiet trading and low risk.
However, if the VIX has fallen too low, it is dangerous as everyone expects the rise to continue. At such times, it's a good idea to start taking profits.
There have been six periods in the history of the VIX index when it was above 40 points. In 1997, 1998, and 2001, the index peaked, and on October 24, 2008, it reached its highest point since it was calculated 89.53 points.
Therefore, based on the values of the volatility index VIX traders derived the rules of stock trading:
1. A rise in the VIX indicates a panic in the market. Investors are dumping stocks, you need to get ready to buy good assets after the sell-off.
2. When VIX fixes above 40-45%, you can open a long position for long-term growth.
3. A decline in the VIX index is a sign of investor calm. They prefer to buy shares, pushing their price upwards, to overbought. It is necessary to keep an eye on the assets, as well as to lock in profits on long positions.
4. Long-term short positions can be opened after the VIX Index has consolidated below the value of 20.
Useful Tools To Spot Indicators

In addition to the forex market sentiment indicators, traders advise making use of additional tools, like Japanese candlestick patterns. They have earned the trust of market participants due to their inherent informativeness and visual presentation of trading data. Candlesticks are an advanced tool for making forecasts of price chart behavior and also help to reveal the mood and psychology of the market.
A Japanese candlestick is a type of price line and also a type of interval chart used for graphical representation of fluctuations of securities, currencies, derivative financial instruments, energy, commodities, and other commodities quotations.
The main difference between a candlestick chart and a standard line chart is that one element contains four indicators instead of one.
And the clarity of candlesticks lets you see repetitive graphical patterns without the long study of the chart, which can be used to open positions. Thus, the information value of graphs increases by an order of magnitude, which greatly simplifies the complex analysis of the market.
In addition, the structure of the candlestick helps to understand such an important aspect of trading, as the psychology of the market. Graphical analysis with the help of Japanese candlesticks reveals characteristic behavioral patterns of market participants, which in turn allows you to reliably predict the future reaction of the market to certain events.
What is market sentiment?
Participants in each market, traders, and investors have their own opinions about why the market works the way it does, and whether to trade in the direction of the market (in the direction of market trends) or go against it (taking the opposite bet).
Traders and investors come with their thoughts and opinions about the market. These thoughts and opinions depend on the position of the traders and investors. That additionally helps in the overall mood of the market no matter what information is out there.
Because retail traders are very small participants in the entire forex market, no matter how strongly you feel about a particular trade (belief), you cannot move the forex markets in your favor.
Even if you (a retail trader) believe that the dollar will rise, but everyone else (the big players) is in a bearish mood, there is nothing you can do about it (unless you are one of the big investment banks like - Goldman Sachs or some ultra-rich person like Warren Buffett).
It is the trader's opinion of how he feels about the market, whether it is bullish or bearish. Depending on this, the trader further decides how to play the perception of market sentiment into the trading strategy.
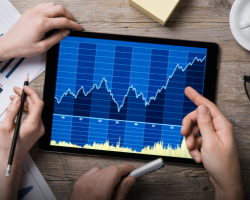
Why do you need a market sentiment indicator?
Market sentiment indicators are essential tools for investors because they indicate a bullish or bearish trend in the market or for an asset in the form of a graph or scale. These tools can be part of market sentiment analysis, but should not be the only source of information. It is best to use several indicators, at the same time, to get a complete picture of the market situation.
Market sentiment analysis is an integral part of many trading strategies along with technical and fundamental analysis. It helps investors evaluate all available information before making any decisions.
For example, sentiment analysis can help us figure out whether the FOMO (fear of missing out) of market participants is justified or simply caused by public opinion. In general, the use of technical and fundamental analyses together with sentiment analysis allows you to:
gain a better understanding of short- and medium-term price movements;
gain better control of your emotional state;
discover potential profit opportunities.
How does market sentiment work?
Stock market sentiment analysis shows the psychological component that drives changes in the market value of trading instruments. If economic and geopolitical factors for a particular country show a strengthening economy that should outperform other countries, this set of circumstances will tend to positively alter underlying market sentiment for that currency and lead to a better valuation of it relative to other currencies.
On the other hand, negative sentiment may arise if less favorable economic indicators are released, showing that a country's economy is slowing, or if a leading economic indicator such as consumer confidence begins to soften in response to less favorable economic indicators, such as a weaker labor market.
For example, if a country is experiencing growth in gross domestic product, a narrowing trade deficit or surplus, attractive interest rates, or strong employment figures, all of these factors should support favorable market sentiment for that currency.
In addition, market sentiment analysis can include a detailed analysis of data showing what percentage of transactions resulted in a particular position in a currency pair and what types of traders chose to take such positions.
For example, consider a situation where nine hundred traders with large volumes have opened a long position on the currency pair EUR/USD, while only one hundred traders with micro lots have opened the opposite of the open short position on EUR/USD. In this case, a possible sentiment indicator may show an overall long position of 90 percent. In addition, this sentiment data will show a 100 percent long position taken by traders with more volume, who are generally considered more professional and, therefore, more likely to determine the future direction of the market.
How to find market sentiment?
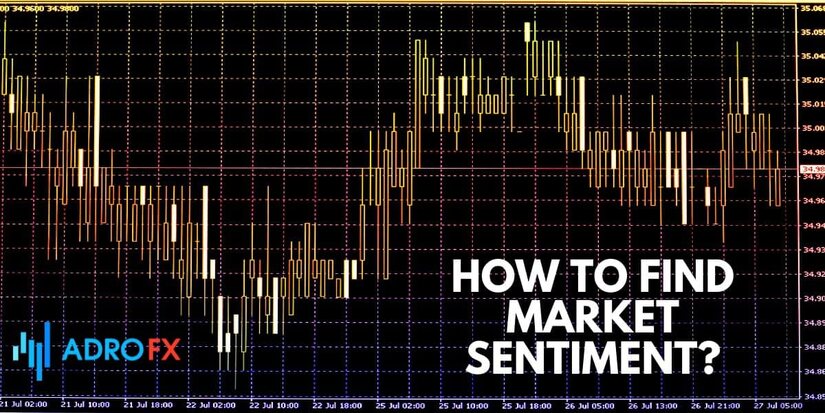
There are many ways to find the sentiment of the stock market. Now, you will learn about the three easiest. The first and fastest is to go to the American Association of Individual Investors or AAII for short.
- AAII Website
The AAII website offers the results of a weekly survey of individual investors regarding their view of the market. How to interpret them?
When the majority (over 60%) of investors are bullish, it may be a good time to sell. Conversely, when the majority (more than 50%) of investors are bearish, it may be a good time to buy.
- Finviz.com
At Finviz.com, you can quickly determine the distribution of power between bulls and bears by 1) the number of stocks going down and up (Advancing/Declining); 2) the number of stocks that have updated their highs and lows (New High/New Low); 3) the position of stocks relative to the Simple Moving Average (SMA) over 50 and 200 days (SMA50, SMA200).
- Barchart.com
Barchart.com, like Finviz.com, analyzes the number of stocks that are falling and rising, as well as stocks that have updated their 52-week highs and lows (New High/New Low), but does so by stock exchange (NYSE, NASDAQ, and AMEX).
We analyze these indicators similarly to Finviz.com: the greater the green portion of the chart, the more bulls in the market.
The advantages of market sentiment indicator
Stock market sentiment indicators help a trader not only to estimate the emotional and psychological mood of other participants but also is a good identifier allowing to make an accurate forecast for the short-term and medium-term perspective.
Any market sentiment indicator helps an investor to increase the accuracy of his forecasts and to track the probable points of pullbacks and trend reversals.
When the traders' sentiment exceeds the critical historical values for a certain instrument, the probability of the end of this trend increases many times, which must be taken into account when opening a position. The critical values of the sentiment indicators are one of the signals of profit-taking by trend positions and preparation of positions for the change of trend.
How to trade market sentiment?
Forex market sentiment indicators cannot be used simply as a source of signals to open a position. As soon as the data indicates the dominance of bulls or bears, there is no need to rush to open the opposite position. In this case, it is rational to look for reversal patterns, which will confirm the conclusions of the trader. It is also recommended to use a bunch of trend indicators Parabolic Sar and ADX, which will confirm trend reversal. In addition, it is important to keep in mind that price indicators do not turn sharply in the opposite direction. Often they fluctuate around an important level for some time and only then begin to reverse.
The specifics of various assets indicate that the presence of only 75% of positions is sufficient for some currency pairs to form a reversal, while for others at least 90% is necessary. To use the data on exchange players' moods correctly, it is necessary to thoroughly study a traded instrument and analyze its behavior depending on traders' moods.
Market sentiment indicators for МТ4
It is impossible to calculate the behavior of millions of traders, but there are MetaTrader 4 market sentiment indicators that calculate the ratio of bulls to bears. Besides the ones we have mentioned above, traders can make use of Sentiment and Volumes.
Sentiment is an oscillator-type market sentiment indicator, which is located at the bottom ofchanges are a reflection of the number of players on the market, trading in one direction or another.
The Volumes indicator is built under the price chart, and in its pure form, it shows the number of transactions in the financial instrument per unit of time (the time unit in this case - the time frame used by the price chart). Such an indicator of volume is better used at the stock exchange, for example.
Sentiment analysis for stock market
Everyone knows that the stocks of most companies heavily depend on social media, including Facebook and Twitter. If you're looking for a prime example of how social media affects the stock market, look at Kylie Jenner's tweet about Snapchat. Shortly after the message was posted online, the price of Snap, the parent company of Snapchat, dropped 8.5 percent. Some investors were able to capitalize on the social media turmoil, The Big Short-style, and made $163 million.
This example fits the efficient market hypothesis. According to the hypothesis: stock market prices are largely determined by new information and follow a pattern of random straying.
Another bright example is Elon Musk`s twits. Whatever he posts is reflected on the price of Tesla stock and even notorious Dogecoin.
So, for you to be on top of things and be acknowledged of everything affecting the price fluctuations, make sure to pay attention to social media too, not only graphs of technical indicators.
How to measure market sentiment in the stock market?
Various indicators can be used to measure the current market sentiment. They try to estimate the market sentiment and express it numerically or graphically. They can be used to infer the current positions and opinions of traders and how they may be affecting price movements.
Here are three popular indicators for assessing forex market sentiment:
DXY
The DXY is a key indicator that shows the current market sentiment towards the world's leading currency. The direction in which the index is moving (current trend) reflects the actual market equilibrium. An increase in the index indicates a positive sentiment in the market and the growth of the USD against major currencies, while a decrease in the index indicates negative sentiment and weakening of the major currencies.

DXY is traded on exchanges as futures and options. With technical analysis, you can analyze the graph of the index and determine the current relationship to the U.S. dollar: positive, negative, or neutral. You can find the DXY chart at various information resources, such as tradingview.com.
COT
The COT report (Commitments of Traders) is a weekly publication that shows the aggregate positions of the various players in the futures markets. The COT is published every Tuesday by the U.S. CFTC. Although this data relates to futures, it is highly correlated with the Forex market.
The COT shows the net long and short positions in futures for currencies (and other assets) of three groups of traders:
- Commercial hedgers are large companies and organizations that use the futures market to hedge their risks in the foreign exchange and spot markets. They moderate the overall sentiment.
- Large traders are large institutional investors, hedge funds, and other organizations that trade in the futures market to invest and make profits. The sentiment of this group is more important.
- Small traders: most of this category consists of private market participants or small companies. Their influence on the market is small.
You can track the market sentiment for currency futures on COT at various analytical resources such as finviz.com. Under the currency futures charts, you can find a chart in which the three groups of traders listed above are represented by three lines. When the lines are positive, buying positions predominate, and when the lines are in the negative area, it means that selling positions predominate.
Moving averages
Another popular and indicative instrument for estimating sentiment is Moving Averages. They show the average value of the chosen currency pair for a certain period. If the price rises above the average, it means that the current mood is positive; if it falls below the average, the mood is negative.
Use short-period MAs (5 to 50) for short-term sentiments, and long-period MAs (100, 200) for long-term sentiments. For example, when the price crosses the 200 SMA from below, it means that the sentiment becomes positive, and an uptrend can begin. Conversely, when the price falls below the 200 SMA, it indicates a negative sentiment and promises a downside trend.
Market Sentiment FAQ
What is market sentiment?
Market sentiment can be defined as the general attitude of investors toward a particular asset or the market as a whole. It is the feeling or tone of the market, its psychology. It is manifested in activity and price movements. It is important to remember that sentiment is not always based on fundamentals. That means investors may have an opinion based on how they feel rather than what they see. "Buy rumors, sell facts."
The mood can be called bearish, neutral, or bullish. When a bearish mood prevails, stocks go down. The same is true for foreign currencies - bearish sentiment will weigh on them. And on the other hand, there can be a bullish outlook that will support stocks and currencies.
Why is sentiment analysis so needed?
Investor sentiment is the collective feeling, sentiment, and belief of market players, including every private investor and the so-called "smart money" of institutional investors. The most accurate sentiment indicators accurately reflect what investors are doing in the market, even if it contradicts their feelings and conversations.
Sentiment analysis tells us what investors expect from stocks, the market sector, or the market as a whole.
Why are market participants' expectations so important?
Because the price of a stock reflects an investor's perceptions of reality, and those perceptions are a great counter-indicator. A stock with relatively low expectations offers a good chance that the stock in question could rise once investors pay attention to it, thanks to good news or other favorable events. Conversely, a stock with high expectations can easily slide lower if players are disappointed in it because of bad news or if their expectations are not confirmed for other reasons.
On the other hand, low expectations for a stock can transform into good buying power, as many skeptical investors are standing by with their money. And they are the ones willing to invest in such stocks if they see good growth potential in them. This demand will certainly lead to an imminent rise in the stock price.
The high expectations tell us that quite a lot of money has already been invested in these stocks. And the buying power may no longer be strong enough to move the stock price higher. Therefore, the selling will prevail over buying in case the news is not good enough, which would make the stock lose its price.
Are there strategies for using the market sentiment indicator?
When using the market sentiment indicator, traders distinguish two strategies. The first is an agreement with the mainstream and entering a position of prevailing popularity, the second is going against the crowd, and betting on the opposite result. The second strategy is more often used when the bulls/bears prevail at 98% or higher, because according to the basic theory of stock trading, at such moments the trend changes direction.
Summary of the use of market sentiment in trading
Information about market sentiment is an essential indicator for predicting market behavior and choosing your strategy when placing an order. Market sentiment is made up of the sentiments of its participants, whose positions, in turn, determine price dynamics.
Market mood is not usually the only tool of a trader when analyzing the market, but it is an excellent auxiliary indicator when trading.
About AdroFx
Being a well-established brokerage company, AdroFx offers the best trading conditions to its clients from 200 countries. Founded by experts with a couple of decades of overall experience, AdroFx is one of the best platforms on the market for shares trading. Either a newbie or experienced trader, both will find here what they are looking for since the company provides various trading accounts for different trading styles and goals.
Related Articles
Latest updates
Latest updates


Technical Analysis
Latest updates


