From Pause to Profit: A Trader's Handbook on Stock Consolidation

Navigating the intricate dynamics of financial markets, traders often encounter a captivating phenomenon known as stock consolidation. This phase is marked by delicate equilibrium in price movements. In this trader's handbook, "From Pause to Profit: A Trader's Handbook on Stock Consolidation," we embark on a comprehensive exploration of stock consolidation, unraveling its intricacies and providing valuable insights and tools to navigate this unique phase of market dynamics.
Understanding Stock Consolidation
Stock consolidation signifies a phase of relative price stability, characterized by a delicate balance between buying and selling pressures in the market. Within this temporal equilibrium, a stock's price adheres to a defined range, where support establishes a price floor, and resistance functions as a price ceiling. This equilibrium creates a horizontal channel on price charts, marking a temporary pause in the prevailing trend.
Key Elements: Support and Resistance
Critical to comprehending stock consolidation are support and resistance levels. Support denotes a price level at which a stock historically struggles to fall below, drawing buying interest. Conversely, resistance represents a level where the stock encounters selling pressure, hindering further price ascent.
Traders employ various technical analysis tools - trendlines, moving averages, and chart patterns - to pinpoint and validate these support and resistance levels. The amalgamation of these indicators facilitates the identification of consolidation boundaries, providing valuable insights during this market phase.
Implications for Traders
While stock consolidation may seem like a period of indecision in the market, it holds valuable information for traders. The stabilizing effect of consolidation provides an opportunity for investors to assess the stock's underlying fundamentals and evaluate potential future price movements.
- Potential Breakout or Breakdown
Consolidation is often seen as a precursor to a significant price movement. Traders closely monitor the support and resistance levels for a potential breakout, signaling a bullish trend, or a breakdown, indicating a bearish trend.
- Volatility Expansion
Following a period of consolidation, traders anticipate a surge in volatility. This can present opportunities for well-timed trades, as increased volatility often accompanies decisive price movements.
- Decision-Making Support
Understanding stock consolidation assists traders in making informed decisions. By identifying the boundaries of the consolidation range, traders can establish entry and exit points, as well as set Stop Loss orders to manage risk.
Identifying Consolidating Stocks
There is no single method of identifying a stock that is consolidating. Below, we explore effective methods for identifying stocks undergoing consolidation within a specific trading range.
- Price Chart Analysis
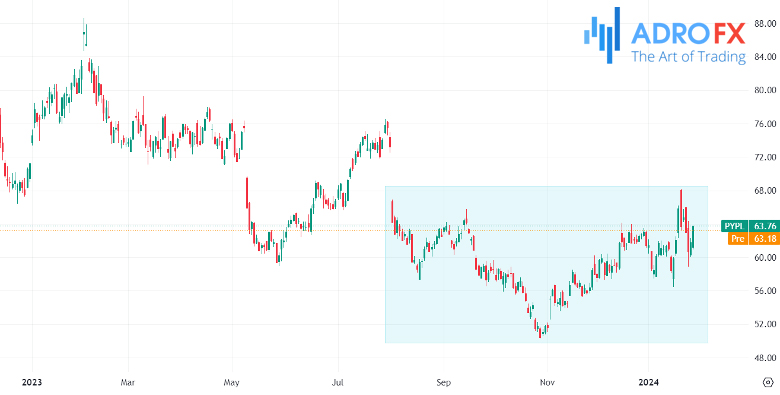
An elemental approach to identifying consolidating stocks involves a comprehensive analysis of price charts. Traders scrutinize the historical price movements of a stock, paying close attention to periods where the price remains within a well-defined range. This range typically exhibits clear support and resistance levels, forming the basis for identifying consolidation.
- Examination of Horizontal Channels
Consolidating stocks often manifest in the creation of horizontal channels on price charts. Traders observe instances where the stock's price moves within a confined band, showcasing a balance between buyers and sellers. The horizontal channel, framed by support at the lower boundary and resistance at the upper limit, is indicative of a consolidation phase.
- Volume Analysis
Volume is a valuable indicator when identifying consolidating stocks. During a consolidation period, trading volume often experiences a decline, reflecting the equilibrium between buying and selling pressures. Traders observe a reduction in volume as the stock hovers within the defined trading range, signaling a temporary pause in the prevailing trend.
- Relative Strength Index (RSI)
Utilizing technical indicators like the Relative Strength Index (RSI) aids in gauging the strength of a stock's price movements. In the context of consolidation, traders look for RSI values within a specific range, typically between 30 and 70. RSI values approaching 50 during a stable price range suggest consolidation, indicating a balanced market sentiment.
- Moving Averages
Moving averages serve as effective tools for identifying consolidating stocks. Traders analyze the interaction between short-term and long-term moving averages. When a stock's price remains close to its moving averages without significant directional movement, it signals consolidation. The convergence of moving averages highlights the stability within the defined trading range.
Incorporating these tactical approaches into one's analytical toolkit equips traders with the means to identify consolidating stocks accurately. By leveraging price chart patterns, volume analysis, technical indicators, and moving averages, traders can navigate the nuances of consolidation phases and make well-informed decisions in dynamic market conditions.
What Do Consolidation Patterns Signify?
Consolidation patterns serve as crucial indicators in technical analysis, revealing the price movement of a stock or asset confined within a specific range. These patterns not only demonstrate the continuation of a consolidation trend but also offer insights into potential changes in market direction.
Traders closely analyze consolidation patterns to discern shifts in market trends and anticipate the nature of these changes. The examination of these patterns aids in distinguishing between false breakouts and genuine market movements.
Various common technical analysis consolidation patterns, essential for traders seeking to make informed decisions in the market, include:
- Price Ranges
Price ranges are depicted on the technical analysis chart by connecting highs and lows with a horizontal line. A range forms when the price oscillates between two horizontal lines, with the upper line indicating resistance and the lower line representing support. Ranges can manifest during sideways, upward, or downward trend movements. However, caution is advised when interpreting range patterns, as they may often lead to false breakouts.
- Symmetrical Triangles
Symmetrical triangles materialize when price movements create two converging trend lines with matching slopes. This consolidation pattern suggests a phase of price stabilization before an eventual breakout or breakdown. During this period, the stock trades within a consistent range, forming a triangle on the chart due to gradually slowing trading activity. Day traders often prefer to engage in trading near the point of convergence of the triangle.
- Ascending Triangles
Ascending triangles develop when a horizontal line is drawn towards swing highs and a rising trend line is connected to swing lows. This consolidation pattern can emerge when the resistance level remains unbroken during the consolidation period. Over time, the support level gradually approaches the resistance level until a breakout occurs.
- Descending Triangles
Formed by connecting a series of lower highs with a trend line and linking a series of lows with another horizontal trend line, descending triangles maintain a constant support level while the resistance level steadily decreases. This consolidation pattern indicates a breakdown in the consolidation phase, leading to a sustained negative trend until an eventual breakdown.
- Rectangles (Flag Patterns)
Also known as flag patterns, rectangular consolidation patterns culminate in either a breakout or breakdown. These patterns emerge as the price moves between two horizontal lines, with each line representing resistance and support, forming a rectangle. The stock exhibits small trading ranges, bouncing off its resistance and support levels until there is a decisive breakout or breakdown from the previous trend.

How Can You Benefit from Consolidation?
Trading during consolidation phases in the stock market requires a nuanced approach, as it involves navigating a period of price stability before the resumption of a trend. Consolidation, marked by a stock's confined movement within a specific trading range, presents both challenges and opportunities for traders. Let's delve into practical strategies to effectively trade consolidation, employing a more accessible language.
- Patience is Key
Consolidation implies a temporary pause in a stock's prevailing trend, and during this phase, patience becomes a trader's ally. Instead of rushing into trades, astute traders wait for the consolidation to provide clear signals of an impending breakout or breakdown. Patience allows for a more comprehensive understanding of the stock's behavior within the defined range.
- Identify Key Support and Resistance
Understanding the dynamics of support and resistance is fundamental in trading consolidation. Support acts as a price floor, preventing the stock from falling further, while resistance acts as a ceiling, curbing upward movement. Traders closely observe these levels to anticipate potential breakouts or breakdowns, serving as entry or exit points.
- Trendline Analysis
Drawing trendlines along the highs and lows during consolidation aids in visualizing the stock's trading range. Breakouts occur when the stock surpasses resistance, and breakdowns manifest when it breaches support. Trendline analysis helps traders identify these critical points, guiding decisions on whether to go long or short.
- Utilize Volatility Indicators
Volatility indicators, such as the Average True Range (ATR), offer insights into the intensity of price movements. During consolidation, low volatility is prevalent. Traders can use volatility indicators to identify potential breakouts, as a surge in volatility often precedes significant price movements.
- Look for Chart Patterns
Chart patterns, such as triangles and rectangles, commonly emerge during consolidation. Triangles indicate tightening price ranges, suggesting an imminent breakout, while rectangles showcase a stable trading range. Traders who can identify these patterns gain a valuable edge in predicting the stock's future direction.
- Embrace Range Trading
Range trading involves taking advantage of a stock's oscillation within a defined range. Traders buy near support levels and sell near resistance levels, exploiting the repetitiveness of the stock's movements. This approach is well-suited for consolidating stocks with well-established trading boundaries.
- Monitor Volume Changes
Changes in trading volume offer critical insights during consolidation. While low volume characterizes the consolidation phase, a sudden spike can precede a breakout or breakdown. Traders keenly monitor volume changes to anticipate shifts in market sentiment.
Trading consolidation requires adaptability and a keen eye for subtle market cues. By patiently observing support and resistance, employing trendline analysis, utilizing volatility indicators, identifying chart patterns, embracing range trading, and monitoring volume changes, traders can navigate consolidation phases with confidence. These strategies empower traders to make informed decisions, optimizing their approach to the unique challenges and opportunities presented by consolidating stocks.
Conclusion
As we conclude our journey through the nuances of stock consolidation, we recognize that this phase, often perceived as a pause in price movements, is indeed a canvas for traders to craft their strategies. Armed with an understanding of support and resistance dynamics, the potential for breakouts or breakdowns, and insights from volatility and chart patterns, traders are well-equipped to thrive in this dynamic market environment. The identified methods for pinpointing consolidating stocks serve as a compass, guiding traders through the nuanced terrain of market analysis. In summary, by exercising patience, employing trendline analysis, and staying vigilant for volume changes, traders step into a world where challenges meet opportunities, and informed decisions pave the way for success amid the subtle currents of the stock market.

About AdroFx
Established in 2018, AdroFx is known for its high technology and its ability to deliver high-quality brokerage services in more than 200 countries around the world. AdroFx makes every effort to keep its customers satisfied and to meet all the trading needs of any trader. With the five types of trading accounts, we have all it takes to fit any traders` needs and styles. The company provides access to 115+ trading instruments, including currencies, metals, stocks, and cryptocurrencies, which make it possible to make the most out of trading on the financial markets. Considering all the above, AdroFx is the perfect variant for anyone who doesn't settle for less than the best.
Related Articles


Latest updates
Latest updates


Technical Analysis
Latest updates


