S&P 500 Dips As Meta's Plunge Affects Tech Outlook | Daily Market Analysis

Key events:
- Japan - BoJ Interest Rate Decision
- USA - Core PCE Price Index (YoY) (Mar)
- USA - Core PCE Price Index (MoM) (Mar)
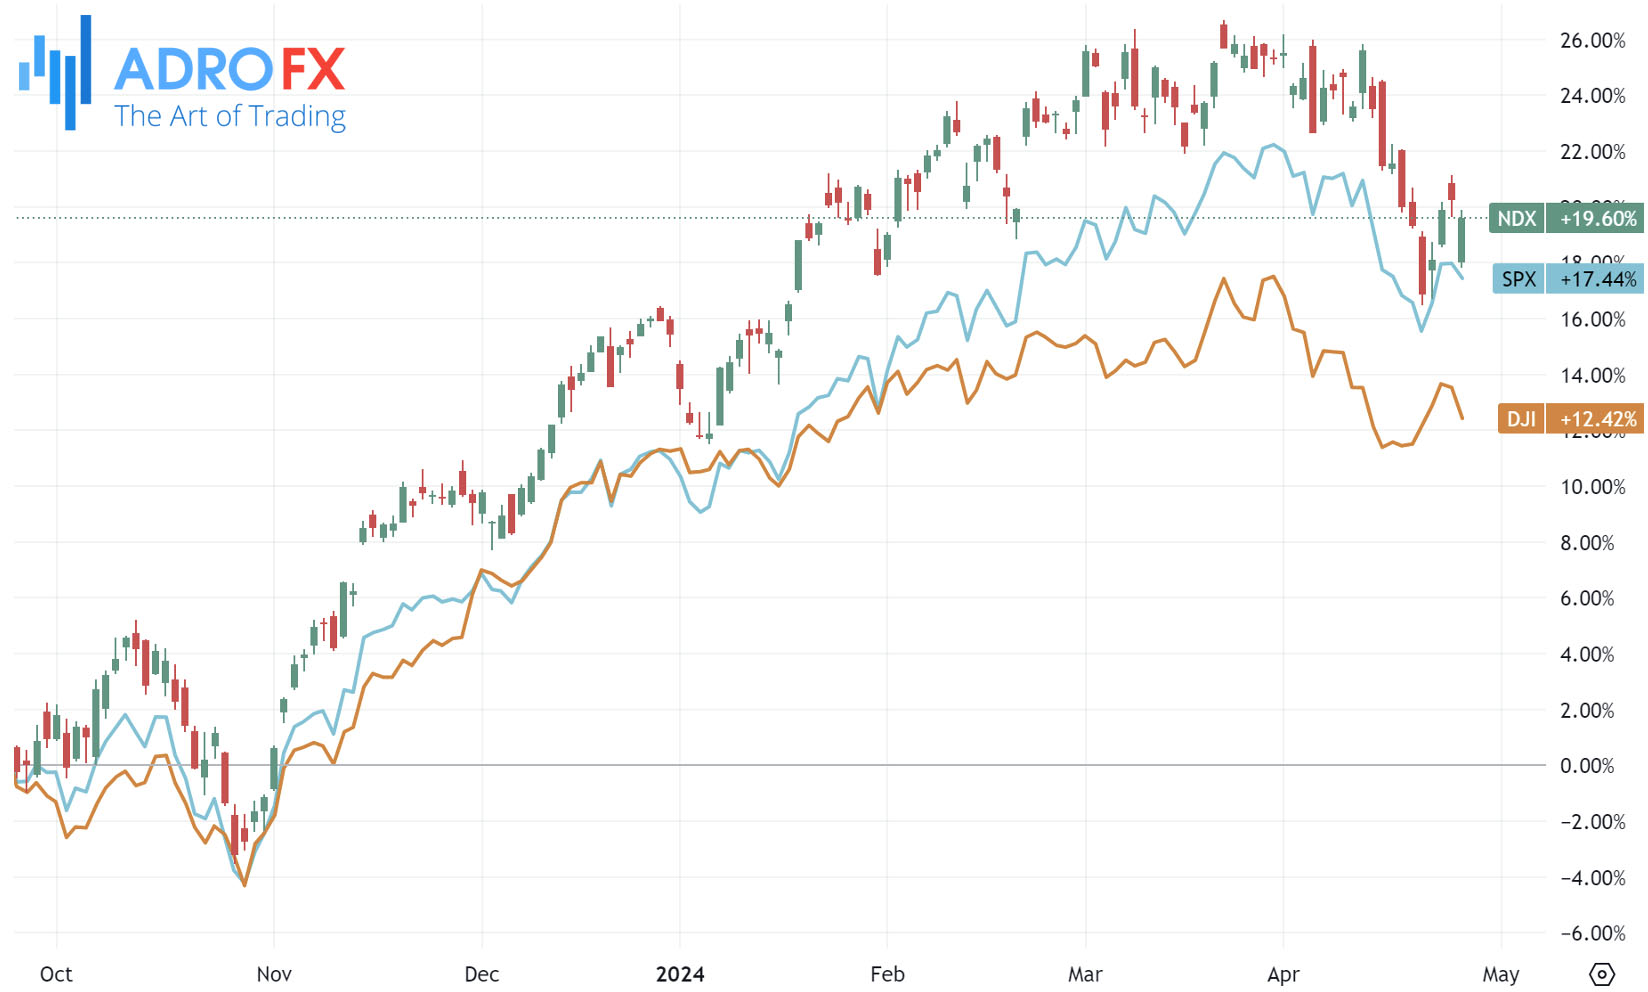
The S&P 500 closed lower on Thursday, although it recovered significantly from session lows as Meta trimmed some losses. Rising Treasury yields, fueled by economic data indicating slowing growth but persistent inflation, compelled traders to delay bets on a first rate cut until December.
The Dow Jones Industrial Average dropped by 375 points, or 1%, while the S&P 500 declined by 0.4%, and the NASDAQ Composite slipped by 0.6%.
Treasury yields surged following reports of just 1.6% growth in the US economy for the first quarter, significantly slower than expected. Additionally, a core measure of inflation in Q1 unexpectedly rose by 3.7%, further postponing rate-cut expectations.
Swaps traders are now refraining from fully pricing in a first Fed rate cut before December.
Despite concerns of stagflation stemming from weaker growth and strong inflation, some economists argue that growth wasn't as feeble as the report indicated. Goldman Sachs noted that while inventories and foreign trade negatively impacted GDP in Q1 by 1.1%, domestic demand growth maintained a robust pace of +2.8% annualized.
Ahead of Friday's release of the PCE price index data, regarded as the Federal Reserve's preferred inflation gauge, Meta Platforms Inc (NASDAQ: META) shares plunged by 10.6% to a nearly three-month low. The decline followed the Facebook parent's forecast of weaker-than-expected revenue for the second quarter due to increased spending on artificial intelligence, with the stock dropping as much as 16% intraday.
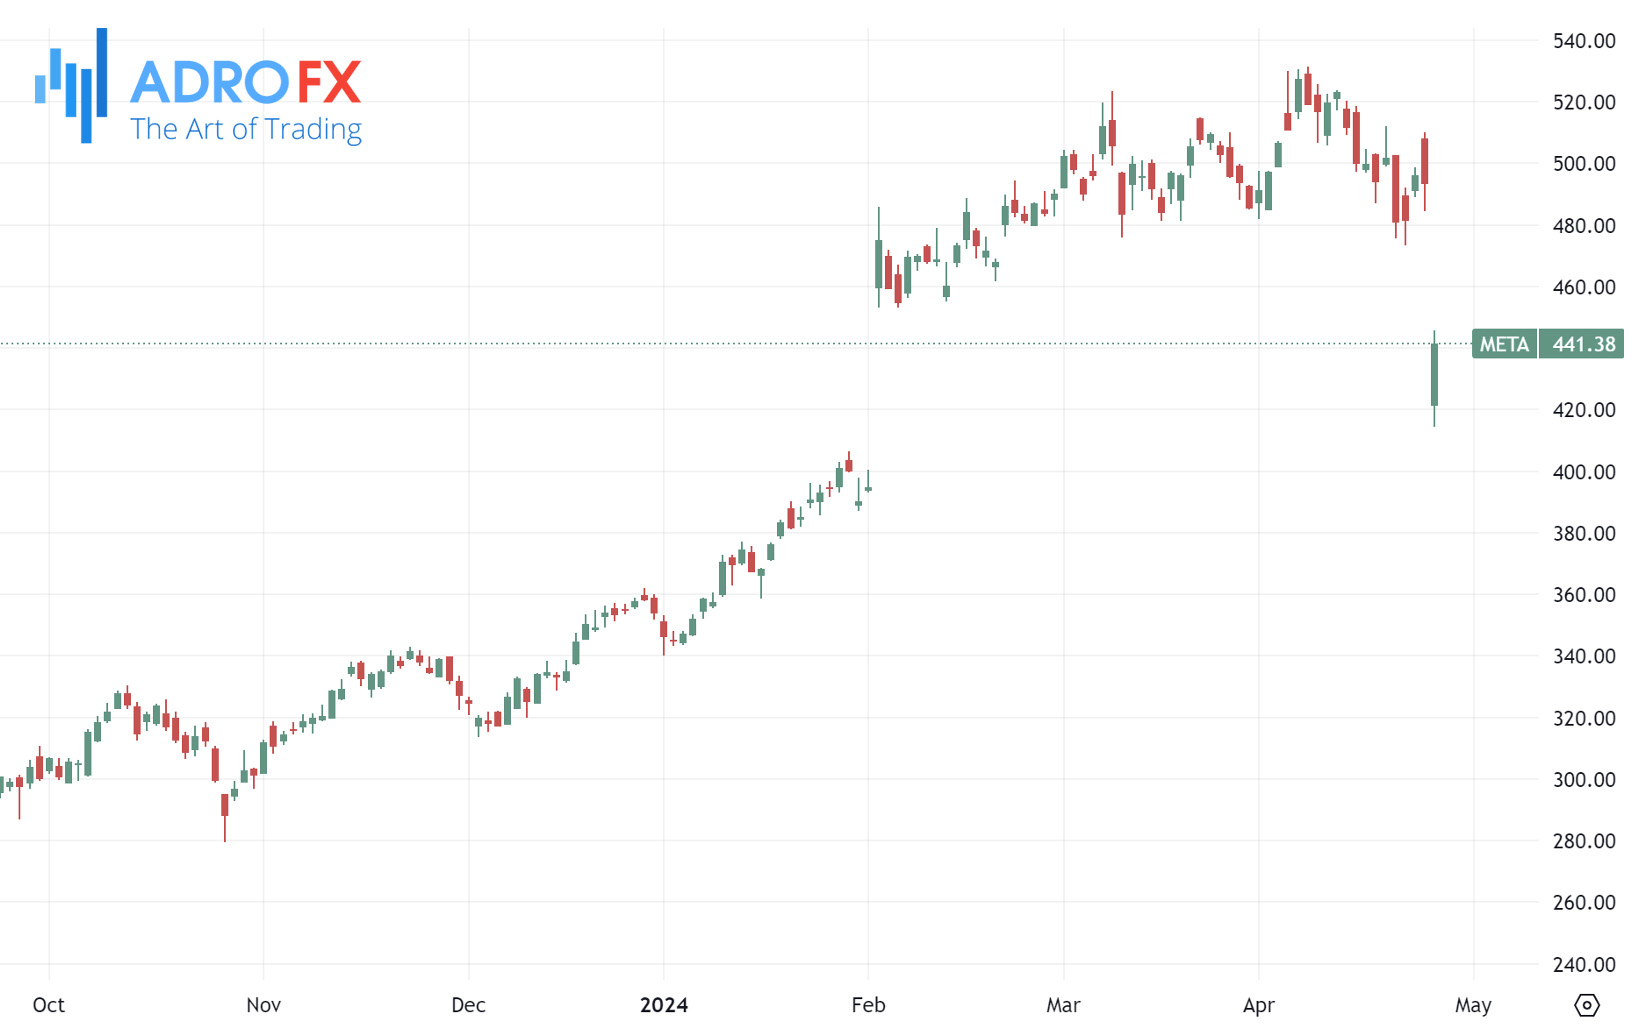
Despite Meta's disappointing guidance offsetting stronger-than-expected first-quarter earnings, it also cast a shadow on upcoming earnings reports from major technology peers such as Microsoft (NASDAQ: MSFT) and Alphabet (NASDAQ: GOOGL), scheduled after Thursday's closing bell.
However, UBS expressed optimism regarding Meta's downturn, highlighting the company's potential for better-than-expected ad revenue growth driven by increased Reels ad load and eCPM growth.
The Japanese Yen faced broad weakness following the Bank of Japan's decision to maintain policy settings unchanged on Friday. This pushed the USD/JPY pair above the 156.00 mark, reaching a fresh 34-year peak during the Asian session. The lack of definitive action by Japanese authorities to bolster the domestic currency, combined with generally positive sentiment in equity markets, contributed significantly to the pressure on the safe-haven JPY.
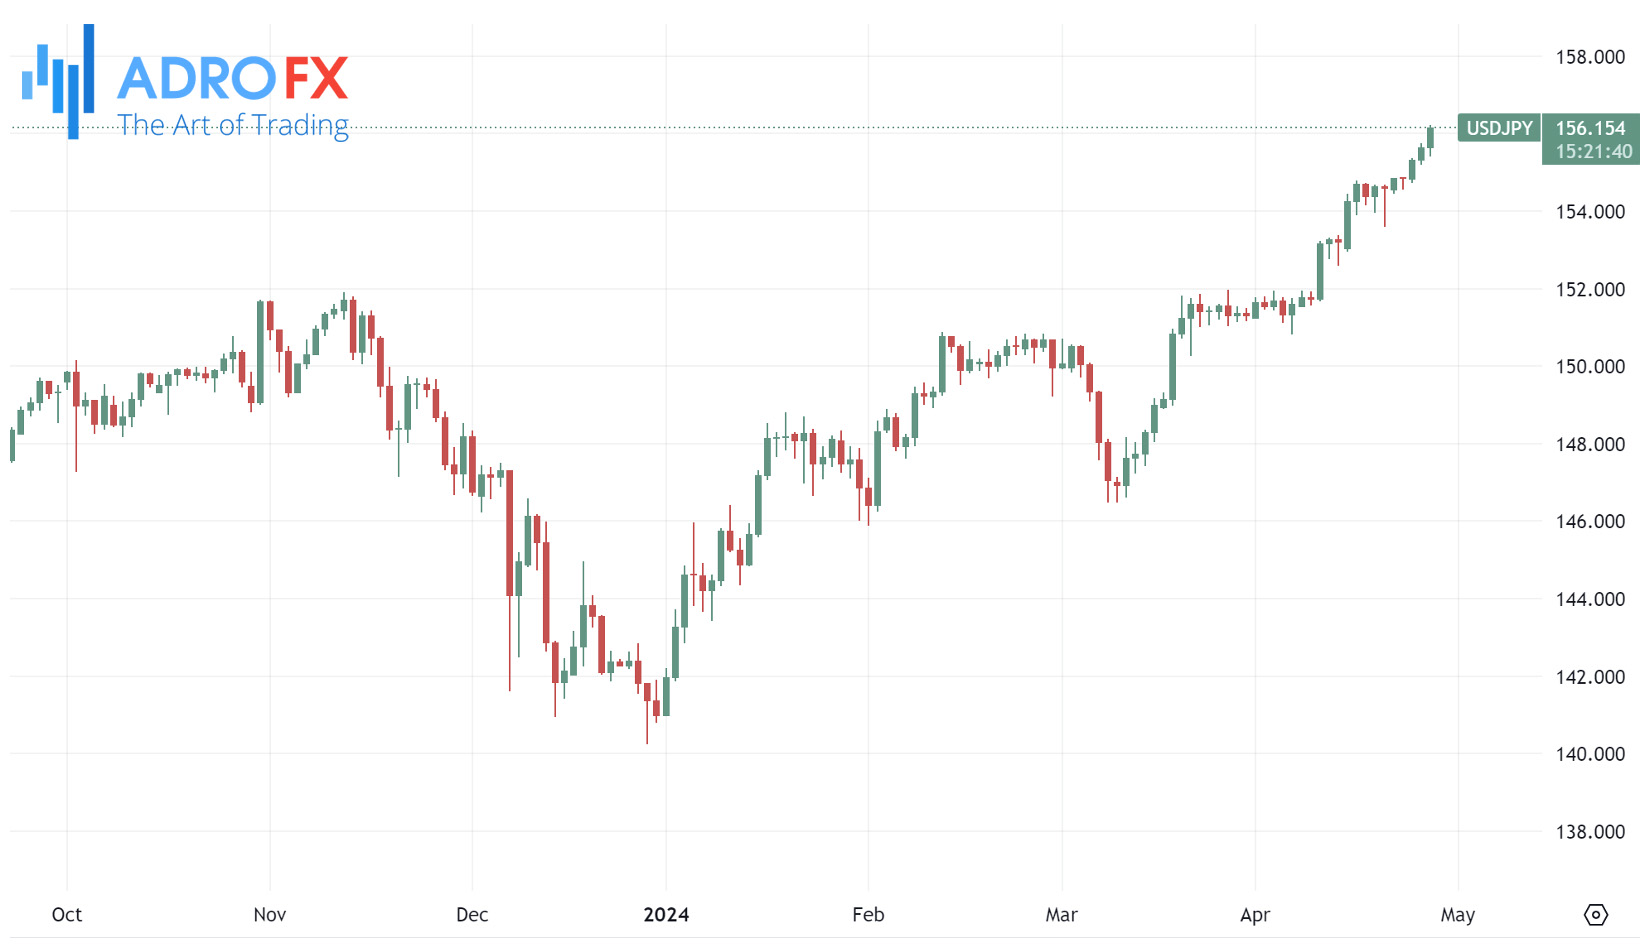
Conversely, the US Dollar attracted new buyers and reversed a portion of the previous day's decline spurred by weaker-than-expected US GDP data, which had pushed it to a two-week low. Expectations of a hawkish stance from the Federal Reserve provided further support to the USD/JPY pair, enhancing the prospects for additional gains. Investors now await cues from the post-BoJ meeting press conference for direction ahead of the release of the US PCE Price Index.
Meanwhile, the Australian Dollar extended its upward trajectory for the fifth consecutive session on Friday. The AUD gained traction against the USD amid increasing speculation of a hawkish stance from the Reserve Bank of Australia. This sentiment was reinforced by TD Securities' reassessment, delaying the anticipated rate cut by the RBA to February 2025 from November.
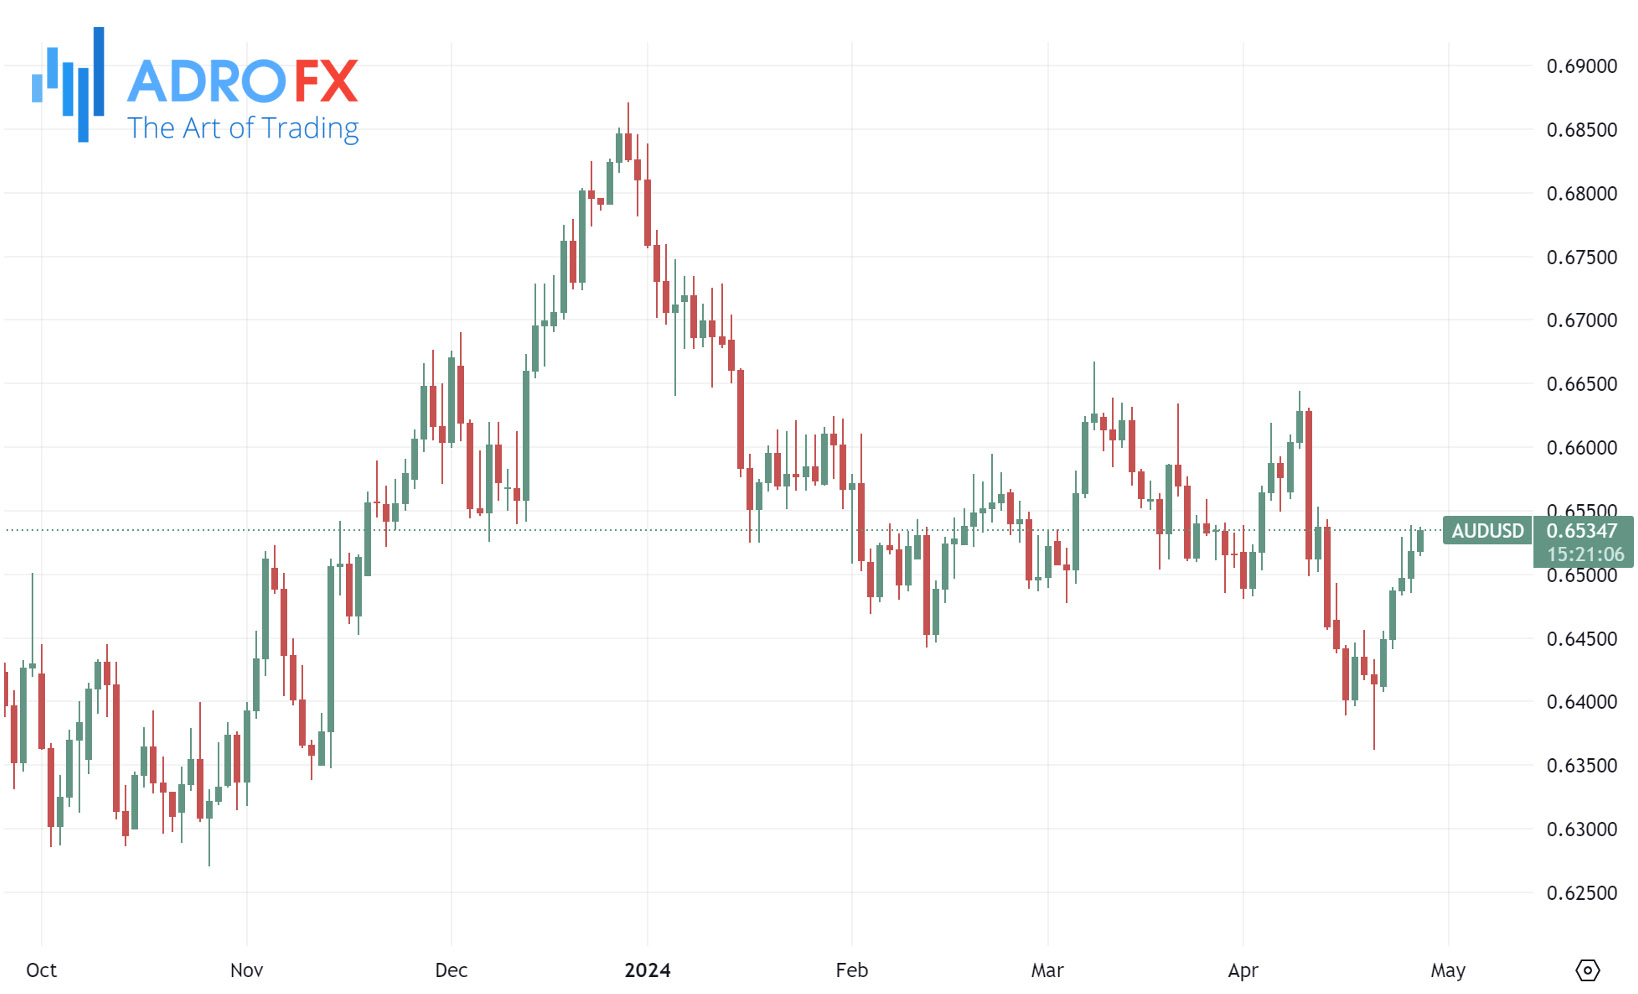
Furthermore, the Australian Dollar strengthened further as yields on Australian government bonds rose, with the 10-year yield hitting a 21-week high of 4.59%. This surge was propelled by Australia's CPI data released on Wednesday, surpassing expectations and fueling hawkish sentiment surrounding the RBA.
In contrast, the EUR/USD pair declined during the Asian session on Friday, moving away from its two-week high around the 1.0740 area reached the previous day. Current spot prices hover around the 1.0725-1.0720 region, influenced by USD price dynamics ahead of crucial US data releases.
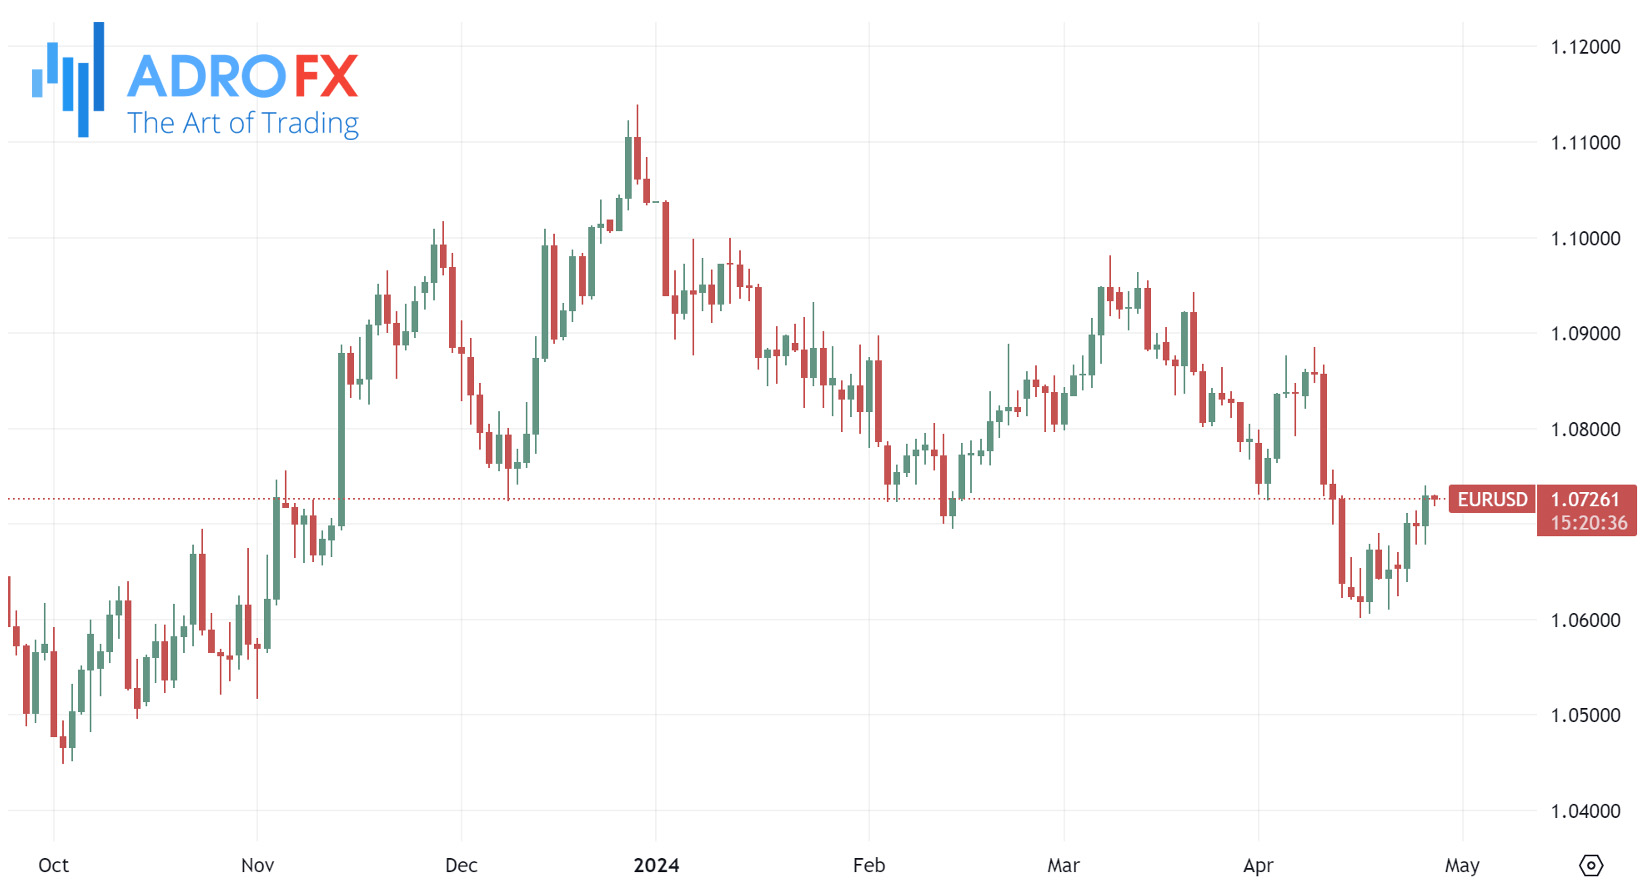
Moreover, expectations of the European Central Bank initiating interest rate cuts in June, amid a quicker-than-anticipated decline in Eurozone inflation, suggest a downward bias for the EUR/USD pair. However, confirmation of a sustained downturn from its recent recovery from the 1.0600 mark, or the year-to-date low, requires strong follow-through selling.
Related Articles


Latest updates
Latest updates


Technical Analysis
Latest updates


