Triangle Chart Pattern Explained
Forex triangles are a very popular concept of price action. There are many misconceptions about what they really show and how to interpret them correctly.
But the truth remains that these patterns can tell you a lot about market dynamics, changes in price momentum, and the balance between bulls and bears in forex. If you know what to look for, of course.
Over the past decades, technical analysis has evolved from classical forms and patterns to sophisticated trading theories and algorithms. However, over the years, triangles have remained the cornerstone of complex trading theories and still accurately reflect the basic interpretation of the market.
Understanding Triangles and Their Types
In textbook terms, this is one of the consolidation patterns in forex, which is formed by drawing two converging trend lines when the price is temporarily moving sideways.
The pattern is one of the simplest technical analysis tools, representing a series of diverging peaks and troughs (according to the canon, at least 4 points are needed to draw a pattern). Simply put, it is two diverging (expanding) lines, crossing each other and forming a triangle.
Symmetrical ones represent so-called areas of indecision, in which the forces of supply and demand in forex are almost equal. Here each new maximum is lower than the previous one, and each new minimum is higher than the previous one. The pattern thereby takes on a triangular shape. This indecision ends when the price breaks the triangle.
Statistics show that breakouts of symmetrical patterns usually occur in the direction of the trend. Therefore, the probability of success is higher when we consider a symmetric pattern as an addition to our main trading strategy.
A triangle says a lot about the market in general and the current situation in forex in particular.
The easiest way to understand them is to draw a parallel with a ball. When you throw a ball, it bounces, but each bounce will be lower than the previous one. The ball loses momentum, and gravity eventually stops it. The energy of the ball disappears completely, and it will no longer bounce until it is tossed again.
Triangles in the trading world work in much the same way. They are a manifestation of the "struggle" (imbalance) between long and short positions in forex. Knowing how to interpret such a scenario will help us make better decisions and deepen our understanding of market dynamics.
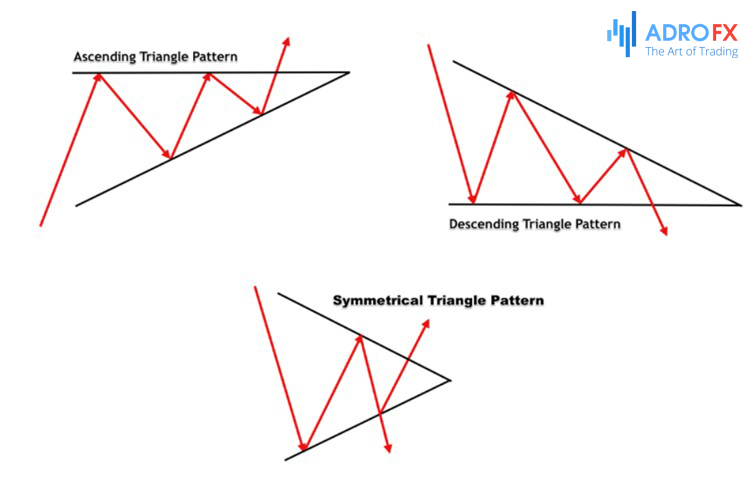
Symmetrical Triangle
A symmetrical triangle occurs when the price movements of an asset become increasingly confined within a smaller range over time. Each upward movement doesn't surpass the height of the previous one, and each downward movement doesn't reach as low as the previous one. This pattern results in lower swing highs and lower swing lows.
By connecting the swing highs with a trendline and the swing lows with another trendline, a symmetrical triangle is formed as these trendlines gradually converge. To draw a triangle, you need to connect two swing highs and two swing lows with the respective trendlines. Traders often wait for the price to form three swing highs or lows before drawing these trendlines since the price may fluctuate within the triangle pattern multiple times.
Ascending Triangle
An ascending triangle is characterized by rising swing lows and swing highs that reach similar price levels. When a trendline is drawn along the comparable swing highs, it forms a horizontal line. Conversely, the trendline connecting the rising swing lows slopes upward, creating an ascending triangle.
Although the price continues to be confined within a smaller range over time, it consistently reaches a similar high point each time the swing low moves up. To draw an ascending triangle, you connect two swing highs and two swing lows with the appropriate trendlines.
Descending Triangle
Conversely, a descending triangle is formed by progressively lower swing highs and swing lows that reach similar price levels as the previous lows. When a trendline is drawn along the comparable swing lows, it creates a horizontal line. On the other hand, the trendline connecting the descending swing highs slopes downward, forming a descending triangle.
In this case, the price is confined within a smaller range, but it consistently reaches a similar low point during each downward movement. To draw a descending triangle, you connect two swing highs and two swing lows using the relevant trendlines.
In practical applications, when there are more than two points to connect, it is common for the trendlines to not perfectly align with every high and low point. That is acceptable; you should draw trendlines that best fit the price action.
Trading Triangles
Breakout Strategy
The breakout strategy is applicable to all types of triangles, whether they are ascending, descending, or symmetrical. The execution of the strategy remains consistent regardless of the specific shape of the triangle.
To implement the breakout strategy, traders buy when the price of an asset exceeds the upper trendline of a triangle or initiate a short sell when the price drops below the lower trendline of the triangle. It's important to note that a breakout occurs when prices move beyond resistance levels or support levels, which are utilized as indicators for trading opportunities.
Since each trader may draw trendlines slightly differently, the precise entry point for executing the breakout strategy may vary. Monitoring volume can be helpful in identifying when the price is breaking out of support or resistance levels, as an increase in volume indicates momentum building towards a breakout.
The primary objective of the breakout strategy is to secure gains as prices move away from the trendlines that form the triangle.
If the price breaks below the support level of the triangle (lower trendline), a short trade is initiated with a Stop Loss order placed above a recent swing high or just above the triangle's resistance level (upper trendline).
Conversely, if the price breaks above the resistance level of the triangle (upper trendline), a long trade is initiated with a Stop Loss order placed below a recent swing low or just below the triangle's support level (lower trendline).
It's important to have exit strategies in place when entering trades, allowing for selling at the appropriate time based on personal criteria.
One approach to exiting a winning trade is by using a return target. A return target is a predetermined price at which an offsetting order is placed. One method is to set a return target that captures a price move equivalent to the entire height of the triangle. For example, if the triangle had a height of $1 at its widest point on the left side, a return target of $1 above the breakout point is set for long trades, or $1 below the breakout point for short trades.
Return targets offer a straightforward approach to exiting successful trades, as traders don't need to actively manage the trade once it is in progress. Eventually, the price will either reach the Stop Loss or the return target. However, it's worth considering that sometimes a trade may generate a substantial earnings without reaching the return target. Traders may choose to incorporate additional criteria into their exit plan, such as exiting the trade if the price starts moving against their position.
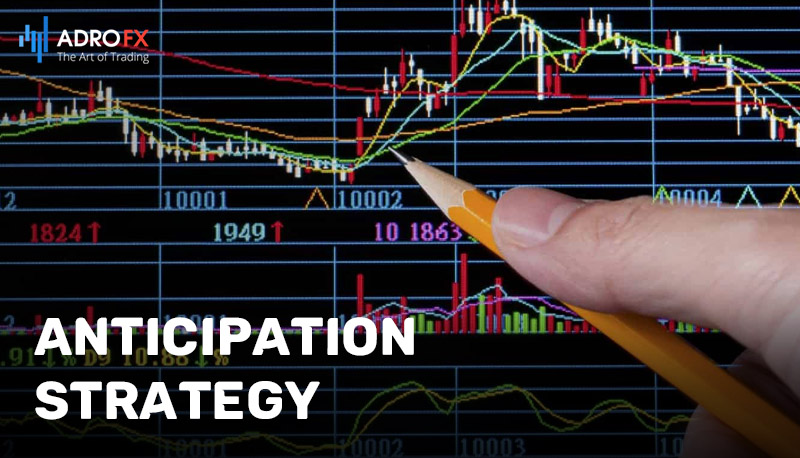
Anticipation Strategy
The anticipation strategy is an advanced variation of the breakout strategy that involves predicting the triangle's stability and anticipating the direction of the eventual breakout. By assuming the triangle will hold and forecasting the breakout direction, traders can discover trades with substantial potential rewards relative to the associated risk.
For instance, if a trader believes the price will ultimately break out to the upside, they can opt to buy near the triangle's support level (the bottom of the low) instead of waiting for the actual breakout. This approach allows them to enter the trade at a lower price, closer to the triangle's bottom, thereby improving their entry point.
To manage risk, a Stop Loss order can be placed just below the triangle. If the price indeed breaks out to the upside, the same target method discussed earlier can be utilized. Due to the lower entry point, a trader who anticipates the breakout stands to potentially make a larger return compared to one who waits for the breakout to occur.
Please note that in market terms, "upsides" refer to upward price movements, while "downsides" indicate downward price movements.
On the other hand, if a trader expects the price to eventually break below the triangle, they can initiate a short sell near the resistance level and place a Stop Loss just above the triangle. By short selling near the top of the triangle, the trader secures a more advantageous price than if they had waited for the downside breakout.
To apply the anticipation strategy, the triangle must touch the support and/or resistance level at least three times. This is because traders typically take a trade on the third (or subsequent) touch of the support or resistance level, as peaks and troughs tend to occur in series of three.
The first two price swings are primarily used to establish the shape of the triangle by drawing trendlines. Therefore, for potential support and resistance levels to be determined and trades to be initiated, the price must touch the level at least three times.
False Breakouts
False breakouts are a common challenge that traders encounter when dealing with triangles or other chart patterns. A false breakout occurs when the price appears to move beyond the boundaries of the triangle, indicating a breakout, but then reverses its direction and may even break out in the opposite direction.
It's important to recognize that false breakouts are a natural part of trading and can lead to losing trades. However, it's crucial not to get discouraged. Not all breakouts will turn out to be false, and interestingly, false breakouts can sometimes present opportunities for traders who employ the anticipation strategy. If you are not already in a trade and the price experiences a false breakout in the opposite direction of your initial expectation, it may be worth considering entering the trade.
For instance, let's say a triangle forms, and based on your analysis of the surrounding price action, you anticipate an eventual upside breakout. However, instead of breaking out upwards, the price briefly dips below the triangle but then rallies back aggressively into the triangle.
In such a scenario, it may be prudent to consider initiating a long trade, placing a Stop Loss order just below the recent low. Since the downward move failed to sustain itself, there is a reasonable likelihood that the price will attempt to move higher, aligning with your original expectation.
It's important to exercise caution and consider risk management techniques when trading false breakouts, as they can still result in losses. However, by adapting to the changing market dynamics and leveraging false breakouts, traders can potentially capitalize on favorable trading opportunities.
Conclusion
Having the ability to interpret and trade triangles is a valuable skill when encountering these patterns. While triangles are commonly observed, they may not occur every day or in every investment. Day traders usually rely on a diverse range of strategies beyond just trading triangles. The concepts discussed here can also be applied to trading other chart patterns, including ranges, wedges, and channels.
It is advisable to practice identifying, drawing, and trading triangles in a demo account before attempting to trade these patterns with real funds. This allows traders to assess their proficiency in employing these strategies and determining if they can generate earnings before risking any actual capital. This practice helps refine trading techniques and enhances decision-making abilities in real trading scenarios.

About AdroFx
Established in 2018, AdroFx is known for its high technology and its ability to deliver high-quality brokerage services in more than 200 countries around the world. AdroFx makes every effort to keep its customers satisfied and to meet all the trading needs of any trader. With the five types of trading accounts, we have all it takes to fit any traders` needs and styles. The company provides access to 115+ trading instruments, including currencies, metals, stocks, and cryptocurrencies, which make it possible to make the most out of trading on the financial markets. Considering all the above, AdroFx is the perfect variant for anyone who doesn't settle for less than the best.
Related Articles


Latest updates
Latest updates


Technical Analysis
Latest updates


