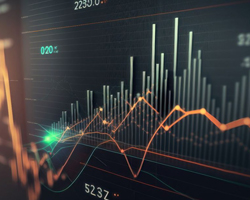
Using Currency Correlations To Your Advantage

In forex trading, a lot of attention is paid to analyzing the behavior of a single asset. A trader opens a chart and watches how the price moves. This, of course, is useful, but there is another way to work in this market - the correlation of currency pairs.
Simple mathematics can significantly improve your trading system. Read the article and your curiosity will pay off.
What is Correlation in Forex
Correlation is the relationship between price movements of compared assets.
Let's take the EUR/USD, for example. Let's assume that we have an uptrend and ask ourselves if other currency pairs are rallying right now. We can open ten charts, select a time frame, compare it, point the finger and say that GBP/USD is there. However, is such a judgment reliable?
Well, it is absolutely unreliable. Perhaps, a chance intervened, and in order to get rid of such an error, the correlation coefficient is calculated.
Types of Correlation
The correlation of currency pairs is defined on the interval from 0 to 1, where zero is a weak positive relationship and one is a very strong positive relationship. The closer the index is to the maximum value, the more synchronously prices move. The same is true for the interval from -0 to -1, with the only difference: the relationship is the opposite.
There is also autocorrelation. It is calculated using data for only one asset in order to see if future prices are related to past prices.
The Difference Between Positive and Negative Correlation
Most novice traders do not understand the difference between positive and negative correlations. To make it easier to grasp, let's compare two groups of currency pairs:
- The first group is EUR/USD and AUD/USD;
- The second group - is EUR/USD and USD/JPY.
Note which currency is included in both pairs of the same group. In our case, it is the American dollar (USD). Now, look at the position of this currency in the pair. In the first group, the dollar is in the denominator of both pairs. That is, these groups of assets are positively correlated with each other.
In the second group, the dollar changes its position. In the first pair, it is behind the slash and is the denominator, and in the second pair - before the slash and is the numerator. Thus, we observe the negative correlation between pairs in this group.
In the case of a positive correlation, the signals on both charts will coincide. If the EUR/USD trend decreases, the same will happen to the AUD/USD chart.
In case of negative correlation, the signals will diverge, i.e. be in inverse dependence on each other. If the EUR/USD trend goes down, then the USD/JPY chart, on the contrary, will show an upward movement of the price.
Searching for correlations between pairs is another way to get leading signals for trading forex. Despite its seeming complexity, it is very simple in action.
Where Does Forex Correlation Come From?
One of the reasons is the similarity of factors that affect the quotes of different currencies. For example, if you take the EUR/USD and GBP/USD pairs, they will have a positive correlation, which is due to the fact that the euro and pound are two European currencies, which often behave similarly against the American currency. Thus, when the economic situation is in favor of the "Europeans", both the euro and pound will rise against the dollar.
The same is true for the negative correlation. For instance, if we look at the EUR/USD and USD/CHF pairs, we will see that in the first pair the European currency is the base currency, while the US dollar is the quote currency. In the second, the situation is reversed: the dollar is the base currency and the franc is the quote currency. Exactly because European and U.S. currencies occupy different positions in these two pairs, we obtain a mirror correlation of currencies.
Pros and Cons of Correlation
The main advantage of the correlation is its ease of understanding and effectiveness in use. It is easy to protect oneself from the risk of making the so-called double trade on currency pairs: if, say, the correlation between EUR/USD and USD/JPY is strongly positive, a trader will not buy the first pair and will not start longing the second one.
As for the disadvantages, not only traders but even statisticians make mistakes when using this tool, which is associated with its disadvantages.
Firstly, the correlation coefficient doesn't reflect the cause-and-effect relation. Therefore it is impossible to unambiguously state, that one currency pair leads to the movement of another one, and vice versa. It is just a dry postulation of the correlation. No one knows what causes it.
Secondly, the variability in time. Today the connection is there, tomorrow it is not. For intraday traders, it is much stronger than for their mid-and long-term colleagues.
Risks
As we mentioned, the risk is key to the likelihood of getting an inaccurate answer on currency pairs. Of course, calculating with your own hands will save you from false judgments, but most people do not want to mess with formulas. Excel comes to the rescue, it greatly simplifies the process of calculation.
Where to Look for Correlation of Currencies
Today there are many sites where you can select assets and time frames and get an answer without doing the math yourself.
They include:
investing.com: easiest to use, nothing too much;
MyFxBook: the most beautiful chart on the Internet.
Correlation Table

How to Use Correlation in Practice
The first method is to avoid "double betting". Do not buy and sell currency pairs or assets with a strong positive correlation at the same time.
The second method - is filtering trades in forex. If a strong positive or negative correlation is detected between two assets, and if one of them generates a signal to go long and the other to go short, it is better to stay out of the market. Ignoring such contradictions leads to losses.
The third method is hedging of trades. If there is a strong negative correlation between two assets, then buying one and immediately selling the other can reduce losses, but the profit, of course, is also reduced.
Examples of Correlation
Let's consider the Daily charts of EUR/JPY and GBP/JPY. According to MyFxBook, their correlation is 0.94.

This is a very strong positive direct correlation. So how do the charts behave?
You can see that the charts are moving almost in unison.
Where to Download Currency Pairs Correlation Indicators for MetaTrader 4
The most presentable, convenient, and practically applicable is the Ind_Correlation indicator. It includes two curves, where the red one is the correlation value for a given period, and the blue one is the arithmetic average of the coefficient.
The calculation of the indicator includes:
- currency pairs;
- time frame;
- quotes shift (when calculating autocorrelation).
Correlation Coefficients
There are two of them - Pearson and Kendall.
Pearson is used when deriving a linear correlation based on a sample. Therefore, it is often referred to as the linear correlation coefficient.
Kendall is used to finding a rank correlation. It doesn't matter what it means because this type is not involved.
Reducing Risk
Risk cannot be fully eliminated, it will always be there. The correlation of currency pairs is not a panacea, you should treat it soberly. It allows you to reduce the number of possible losses with the right approach, but it does not make the avoidance of any losses credible.
Doubling Profits or Losses>
Is there any difference between opening a double unidirectional position on one asset and opening the same order, but on the correlated two?
Yes. Mainly in the profits, which will be lower with equal pips and equal lots if you use the second option because the correlation coefficient is never equal to 1, hence, the other asset will move either slower or with a shorter distance. This is true for both profits and losses.
Risk Diversification
Only long-term traders can use correlation in forex to reduce risk in a portfolio. It is necessary and sufficient to buy or sell assets with a strong negative correlation.
Risk Hedging
If you open two unidirectional positions (e.g. longs) for pairs with a strong negative correlation, you can thus limit your losses.
It should be noted that this approach is more practiced by banks and companies trading commodities on the international market. And they do it with the help of futures.
Correlation: Breakouts and False Breakouts
It is possible to verify the truth or falsity of a price level breakout by looking at another chart that has a strong positive correlation. The tactic is simple: if there is a breakout on the currency pair being traded and a reversal on the adjacent pair, participants will likely hold the level.
Currency Pairs Correlation Strategy
Tracking pair correlation signals manually is quite a time-consuming task. You have to constantly switch between charts, analyzing the price dynamics on each of them. To simplify this task there is a special indicator - Overlay Chart. It is designed to find the correlation between any two trading assets.
The tool works on a simple principle. It overlays one chart on top of another and then compares their dynamics.
Overlay Chart is a custom tool, so after downloading it will have to be added to the terminal separately. To do this, copy all of the installation files into the folder with the indicators in the root folder of the data folder. After the installation, restart the terminal and add the tool to the chart through the "Navigator" panel.
After adding the indicator to the chart, select the pairs whose quotes will be compared. For example, we will look for the correlation between EUR/USD and USD/JPY. Enter the name of both pairs without a slash in the indicator settings.
The tool will show two charts in the same window, which will be superimposed on each other. For your convenience, the candlesticks on the charts will be colored in different colors, contrasting with each other. This will not confuse the signals.
You can use the "Mirroring" function to trade on the signals of inverse correlation by enabling it in the tool's settings. This parameter is responsible for mirroring the lower chart. After activation of "Mirroring", the lower chart will be mirrored horizontally.
Trading Rules:
It is recommended to create several templates to trade according to the indicator signals. For this purpose open separate charts of both currency pairs used for the search of signals and draw trend lines on each of them. Set the Overlay Chart indicator on each of them with the mirroring function enabled. When the bottom chart is mirrored, draw a similar trend line on it.
The QQE indicator can also be used without overlaying to determine the trend.
Now the only thing left to do is to wait for the correlation to occur. As soon as such a signal appears, you can open an appropriate trade on any of the charts.
The stronger the negative correlation - the stronger the reversal signal. Wait for the moment when the trend lines of the charts as much as possible diverge in different directions, and only then open an order.
For example:
- The trend of one chart is going upwards. Inversely, the chart of the linked pair should go downwards, on the principle of inverse correlation. We place a sell order on it.
- The trend of one of the pairs is moving downwards. On the second chart, the trend should, on the contrary, go upwards. On this chart, we place a buy order.
The direction of the trend can be identified not only by trend lines. Any technical indicators, such as the MACD histogram, can be used for this purpose.
When trading by correlation signals, it is important to consider the rules of fundamental market analysis. For example, at different periods of time, some currency pairs are no longer correlated with each other. A vivid example is EUR/USD and GBP/USD pairs.
According to all the standard rules of market analysis, these pairs should be directly correlated with each other, since in both assets the dollar is in the denominator after the slash. But at the moment we can see the weakening of this correlation. This is caused by the economic and political situation in Britain, including the exit of this country from the European Union.
Risk Management
As we said before, the risk can be reduced by avoiding double bets or buying opposite pairs in a portfolio if a trader plays long term.
However, nothing prevents you from going further. Ralph Vince suggests applying this math to trading results. Magic statistics will help reveal the presence of patterns, such as every profitable trade leads to a losing trade and vice versa. If this problem is detected, a trader should eliminate it by redoing some parameters of his trading system.
Vince perfectly and very accurately described the essence of this scheme in his book "The Mathematics of Money Management". You have to think while reading it. However, the money saved on mistakes that didn't happen in forex was worth it.
Conclusion
The language of the market is mathematics. And the better a trader knows it, the lower the risks will be. The correlation of currency pairs helps to understand better the structure of forex.
It is important to remember:
- correlation is an interrelation, but not a cause-and-effect relationship;
- it allows you to avoid double bets, determine the veracity of a breakout, to insure;
- when using it, the equality of time frames should be observed.
Look for the connection, be vigilant, and succeed!
Related Articles


Latest updates
Latest updates


Technical Analysis
Latest updates


