What's the Logic Behind the Stock Market Optimism? | Daily Market Analysis

Key events:
- UK – Average Earnings Index +Bonus (Sep)
- UK – Claimant Count Change (Oct)
- USA – PPI (MoM) (Oct)
The market was swept by another wave – this time of incredible positivity and general joy. Indices are rising very confidently and briskly no matter what, the dollar index is falling, and bond yields have stopped... Many things happened last week. Let's bring it all up in order.
We'll start today with the metals market, specifically copper. After all, it, more than anyone else, can quite accurately indicate the current market sentiment.
Copper has shown a strong uptrend for the second week in a row. It's very technical, like in Murphy's book – the descending trendline was broken out by an equilateral triangle consolidation, which was followed by a strong exit to the upside. This sentiment in copper tells us that the rise in risky instruments is a healthy move, not an aberration.
Gold also reflects investors' confidence in what is happening.
It's the same as the copper, only with a little delay – the trend was broken out quite confidently, except the trading volume is a little bit confusing.
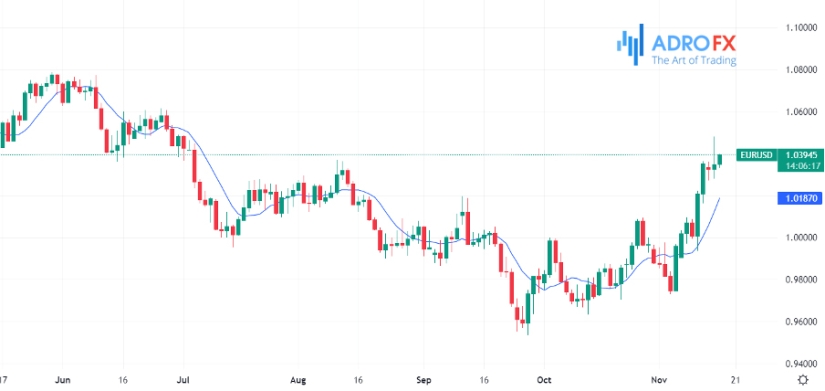
Next, we turn to the Dollar Index.
Judging by the very strong decline last week, as well as by the growth of metals, especially gold, the market participants spread their wings and began to leave the only, until recently, the only protective asset - the money supply. The stress was so severe that they lost confidence in everything except good old cash.
Until recently, neither gold nor Treasury securities protected investors from market stress - they declined in sync with the broad market index. The current market crisis has a structural character, gradually pushing market participants into cash.
Now we can look at the volatility index.
After reaching the ceiling of 33 bps. VIX has been steadily decreasing for the 4th week in a row, indicating to us the organicity of the current growth of risk assets.
The result of the above-described movements was a sharp rise in risky instruments.
The NASDAQ index of technology companies and the Dow Jones Industrial Average both saw the most impressive growth pattern as they broke a solid resistance in the shape of a downtrend line, which has kept indices from "raising their heads" for a very long time.
This is a serious bid for success, and now it's important to get a foothold higher than that on the weekly chart.
If we refer to the reasons for that incredible optimism, the most important driver was the inflation report.
For the first time in a while, these statistics made us happy. Inflation fell much more than expected according to forecasts. Also, the decrease in core inflation is not unimportant, because we all know that it is much more stable due to the characteristics of the instruments it contains.
Immediately after the release of the inflation data the market participants softened their expectations of the key rate increase next week.
According to the new expectations, we are looking at a 0.25% to 0.5% hike, no more. That's pretty mild compared to the last time the Fed raised the rate three times in a row by 0.75%.
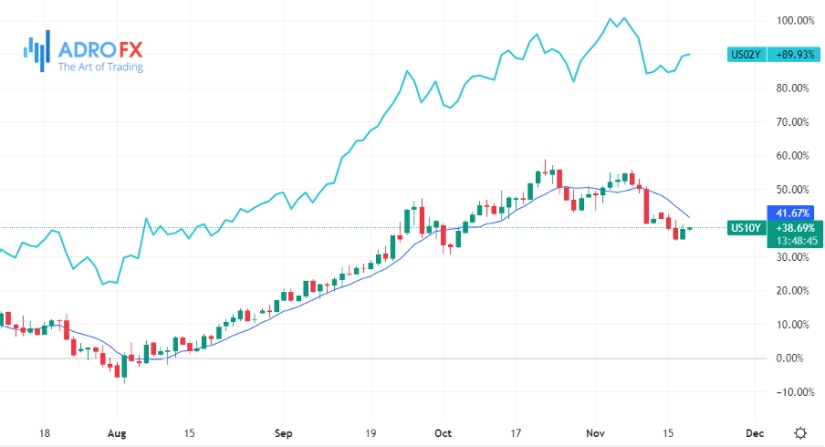
Of course, such data immediately lowered inflation expectations in the face of ten-year yields.
Technically, we can also observe the breakdown of the uptrend line and the subsequent decline in yields.
The inflation data took too much attention and many market participants forgot about Powell's words that the Fed is keeping a close eye on the yield curve of treasury securities.
At the moment, the recession in the U.S. economy is no longer technical, but actual - the yield on three-month Treasury securities is much higher than ten-years. This is the most "reliable" inversion of the yield curve, which indicates a recession in the U.S. economy. In light of this picture, we can expect inflation to fall further, as the economy is getting a major slowdown.
This is also what the labor market data will tell us, which is still somewhat resisting the rapid slowdown in the economy. Also, this week will show us fresh data on home sales and new home construction in the states. These statistics are an indirect and very accurate indication of the current health of the purse strings of U.S. citizens, giving us a clue as to trends in the labor market and the economy as a whole.
Summing up, we come to the fact that there is a complete oxymoron in the stock market - the country's economy is showing a slowdown, being already in a deep recession, and market participants do not care about this at all. They're just like little kids, rejoicing over the decline in inflation and buying heavily discounted risky assets, anticipating the easing of monetary policy. They just don't care about the rest of it yet.

Related Articles


Latest updates
Latest updates


Technical Analysis
Latest updates


