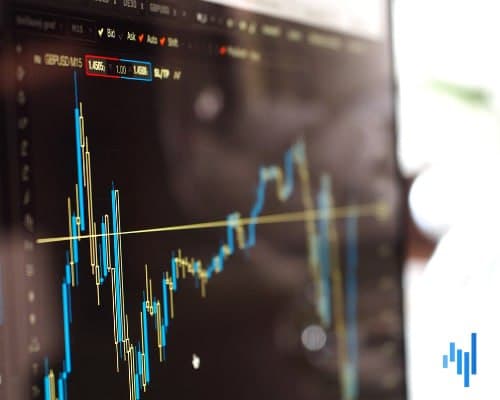
How to Use Gann Fans to Trade Forex

In trading, levels where price changes direction (resistance or support) are often used. You can draw them yourself, but it is easier to use indicators. For example, Gann fans is a tool, which is available in any trading terminal. It consists of 9 rays, by which it is possible to find the reversal points as well as the optimal values for setting Stop Loss and Take Profit.
In this article, we will learn more about the Gann fans indicator and go through its
Description of the Indicator and Setup Rules
Graphically, the indicator represents several straight lines, which diverge from one point at different angles. That is why it is also called a Gann angles.
As you can see, the straight lines continue to serve as a guide to the future price movement. Of course, in practice the chart may turn in the opposite direction or just flat, moving in a narrow range. Therefore, it will be impossible to predict the price movement of these lines by 100%. In any case, they serve as a reference point that can be used for determining the trend reversal points.
The indicator can be found in the MT4 catalog or its upgraded version MT5. Therefore, there is no need to download it. It is enough to go to the "Insert" section and then perform a few steps, as shown in the screenshot below:

Tools for trading — Gann Fans
The Basis of the Gann Fans
The indicator shows the cycles of the trend. It allows to determine:
- the current price direction;
- the strength of the trend;
- the stage of trend development (whether it is emerging or ending);
- possible pivot points.
It should be understood that the Gann fan is not a trend line. It gives only reference points — points, to which the price can come in some time (hours or even days). Although it happens sometimes, several lines coincide with the trend line, i.e. the fan line is moving near the candlesticks.
Gann lines are drawn at certain angles based on several indicators:
- current price;
- price corridor (the range where the chart is moving);
- time frame;
- wave movement (cycle) of price.
Gann fans is a universal indicator because it is based on general market laws:
In high time frames, price moves predictably because it changes cyclically. Therefore, future cycles can be calculated based on history (past data).
In any market, there are resistance and support price levels. They hold the price at certain levels and may last for a long time — days, weeks, or even months.
Eventually, these levels may be broken out, and then the trend will continue. Another possibility is that the price will reach resistance or support levels, encounter them and reverse.
The application of the described patterns allows predicting the price movement reliably enough — the forecasting accuracy is 85-90%, which allows for making stable earnings in forex.
Drawing Gann Fans on the Chart
It's easy enough to draw the lines. The fan consists of 9 lines — one goes at an angle of 45 degrees. The other lines evenly go up and down from it (4 lines each). Each has its designation, as described in the table.
As a result, the graph will look like this.

Drawing Gann Fans on the Chart
As you can see, the ray at an angle of 45 degrees well shows the direction of the trend. It often coincides with the trend line — the candles go along the main ray. The other lines of the fan diverge at different angles in the table above.
The marked line is the most important reference point:
- If the candles go under it — the market is in a downtrend.
- If the candles go above it — the market is in an uptrend.
The base point from which the rays of the fan diverge is set at the beginning of a trend - upward or downward.
The fan lines have different functions:
- They show where the price may reach in some time.
- They help determine pivot points.
- They are resistance or support lines.
- Help set Stop Loss and Take Profit.
This is why Gann fans are used as the main tool for an effective trading system. Although it can be used as an additional indicator.
How to Draw Gunn Fans
To draw the angles you need:
Take the Gann Angles indicator as described above.
Place the cursor at the beginning of the current trend (price minimum for an uptrend or price maximum for a downtrend).
Stretch the fan to the furthest point — i.e. to the end of the current trend that has formed at the moment. To do that, press the left mouse button and hold it down until the Gann fans are drawn.
Look at the points where the candlesticks crossed the fan lines.
Draw horizontal lines along with them — they will be resistance or support price levels.
It is very easy to construct the Gann Fan, especially since it does not have to be done manually. There is a special indicator that allows you to stretch the corners on any chart. As new trends advance and develop, previous grids should be removed and new ones — ascending or descending — should be placed.
It is important to understand, though, that it is not enough to use a fan alone. Other tools should also be used for confident trading:
- Price levels (resistance, support);
- Fibonacci lines;
- Technical indicators;
- Patterns of Price Action.
Especially interesting is the variant of a combination of Gann fans with Fibonacci lines. These are horizontal levels, which intersect with the fans. The result is several points of intersection, at which the price can change direction. These are the resistance or support lines. All a trader has to do is to wait for the price to reach such points and see if it reverses direction.
How to use Gann Angles in practice
There are several variants of how to use Gann fans. For example, it is possible to draw one marking or 2 at once. The most effective techniques are described below.
One fan
This is the simplest variant to start studying the indicator. It is enough to find a currency pair with a well-defined trend and put the indicator in a base point, and then stretch the grid. You will get the following picture (based on the example of an uptrend).
The price will move mainly along the main line of the Gann Fan. Though, at some moment it can change its direction — it will be a signal of the opposite trend initiation.
Two fans
If two trends are present on the chart — descending and ascending or vice versa, it is necessary to draw two Gann fans at once — one is put at the beginning of one trend, the second — of the second one. As a result, their lines will cross in several places. When the price reaches these points, it is necessary to observe the chart. If it starts to turn, it is possible to open a trade in the direction of the new trend.

Tools for Trading — How to Draw Two Gunn Fans
Dynamic Fan
This is the same fan, but it is not created at the beginning of a trend but a local high or low. For example, 3 days ago an uptrend emerged. Then the price made a pullback in the opposite direction (down). Having reached a certain point, it went upward again. It will be the basis point for the dynamic fan (the mark-up is carried out by the same rules).
Similarly, it is possible to set the opposite mark-up by the upper point, to which the price will reach after the pullback. This will be the local maximum. As in the previous case, the two fans will intersect and give several important points. Resistance and support lines can be drawn using them.
We recommend further studying the Gann Square indicator. It can be added to the chart at the same time as the fan. The points of their intersections will indicate the places of the most probable trend reversal.
Strategy based on the Gann fan and MACD
The Gann fans indicator is most commonly used in combination with one or two other tools. As an example, we can consider a trading strategy using the popular MACD oscillator. It is also available in the catalog of any terminal - you can add the tool following this instruction.
MACD also gives the following trading signals:
- Buy - exit of the histogram from the zone below the zero mark.
- Sell - exit of the histogram from the zone higher than the zero mark.
If simultaneously with the signal from MACD the price crosses with the fan lines, it considerably increases the probability of correct forecasting. It is the combination of these two indicators that forms the basis of an effective trading strategy giving an accuracy of 85% or more.
Stop Loss can be placed on the nearest price extremum. The resistance or support line can be used for this purpose. Profit is fixed when the price passes 40-50 points. You can also use a Trailing Stop.
Trading with Gann Signal Systems
The presence of the Gann Angles indicator in the terminal allows for partial automation. A trader does not need to apply a fan by himself - it's enough to take the necessary instrument, determine the base point, and apply the markup.
A special system Gann Signal Systems has been recently developed that automatically adds a fan to any chart. Now there is no need to look for the base points - the system will do it for you.
This approach has a distinct advantage — you can not do the routine work, and leave everything to the indicator. Although, the accuracy of the indicator is not always up to par. Therefore, after it has plotted the grid, it is better to double-check the data once again.
Another important point — is that Gann fans can be applied only when there is a clear trend in the market. If it is weak or the price is moving in a narrow corridor, the fan will also be able to be applied. But it will give false signals, which should not be used.
It is also important to follow the rules of risk management when trading. The volume of a single trade should not exceed 2-3% of the current deposit. And if important news is expected, you should not open orders an hour before and an hour after the publication.
Thus, Gann fans — a quite simple and straightforward indicator, suitable for all currency pairs and other assets. It is recommended to use it with different instruments — for example, with Fibonacci lines or oscillators.
About AdroFx
Established in 2018, AdroFx is known for its high technology and its ability to deliver high-quality brokerage services in more than 200 countries around the world. AdroFx makes every effort to keep its customers satisfied and to meet all the trading needs of any trader. With the five types of trading accounts, we have all it takes to fit any traders` needs and styles. The company provides access to 115+ trading instruments, including currencies, metals, stocks, and cryptocurrencies, which make it possible to make the most out of trading on the financial markets. Considering all of the above, AdroFx is the perfect variant for anyone who doesn't settle for less than the best.
Related Articles

Latest updates
Latest updates


Technical Analysis
Latest updates


