Market Volatility: Strategies, Tools, and Insights for Traders
Volatility stands as a pivotal element within the financial market, denoting the degree and speed at which an asset's price changes over time.
Greater volatility indicates rapid fluctuations in the asset. For instance, if a stock commences trading at $10, ascends to $13, and then descends to $9 within a single session, particularly in a brief span, it qualifies as highly volatile - especially pertinent for scalpers.
The concept of volatility distinguishes itself from other market phenomena, such as a ranging market characterized by an asset maintaining a confined range over an extended period. Additionally, volatility differs from trends, be they upward or downward.
In essence, volatility is a critical consideration for traders engaged in short-term transactions. This article aims to delve into an exhaustive analysis of volatility, exploring optimal techniques to leverage it for strategic advantage while averting substantial losses.
Understanding Volatility in Stocks
Volatility, in the context of stocks, refers to the scenario where stock prices experience swift and frequent fluctuations over brief time intervals, spanning minutes or days. Day traders, primarily concerned with immediate gains rather than a company's long-term prospects, find this period potentially lucrative.
Nevertheless, such volatility can also pose substantial risks, particularly when traders lack adequate preparedness or tools to navigate it.
A poignant illustration of stock market volatility transpired with GameStop (GME) in January 2021.
GameStop, a substantial player in a conventional industry selling video games through physical stores, faced skepticism due to the industry's shift toward digital platforms. Many investors speculated on the company's imminent bankruptcy, prompting sizable short bets against it.
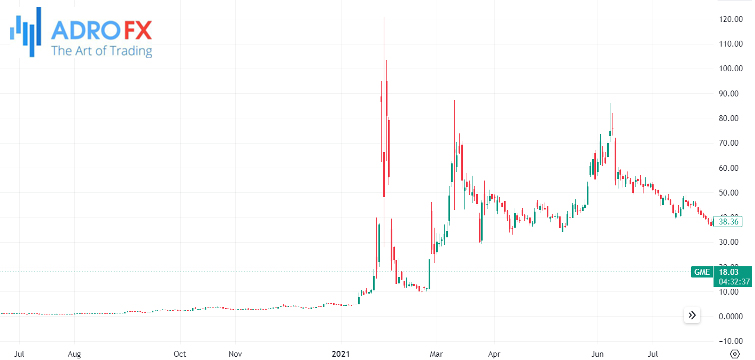
In 2021, social media users heightened the stock's visibility, causing a rapid surge from $17 to $483 within a few days. Subsequently, it experienced a decline to $38 and a subsequent rebound to $182. This episode encapsulates the essence of volatility in the stock market.
Implications of Volatility
High volatility often indicates that an asset is subject to notable events, driving increased demand and supply. Day traders are drawn to highly volatile stocks due to the potential for significant price swings.
Conversely, low volatility signals a lack of substantial market interest or noteworthy developments. Day traders generally find low-volatile markets less appealing for trading activities. In essence, comprehending volatility is essential for making informed decisions in the dynamic realm of financial markets.
Varieties of Volatility
The realm of volatility encompasses three principal types: historical, implied, and realized.
- Historical Volatility
As its name implies, historical volatility is a metric that gauges how volatile an asset has been during a specific timeframe. Certain financial assets exhibit consistent volatility, and thus, an asset boasting high historical volatility is likely to maintain a similar pattern in the future.
The calculation for historical volatility employs the following formula:
Historical Volatility = √[(∑(Ri – Ravg)²)/(n – 1)]
Here, Ri represents the return for period i, Ravg is the average return over the specified period, and n denotes the number of periods.
- Implied Volatility
In contrast, implied volatility is a crucial facet predominantly observed in the options market. It serves as a gauge of the market's anticipation of future volatility. The prevalent method for assessing this volatility is the Black-Scholes model. Unlike historical volatility, implied volatility is forward-looking, enabling predictions of an asset's future price. Factors influencing this volatility include the time to expiration, strike price, interest rates, and various news and events.
- Realized Volatility
Realized volatility stands as another variant. It measures the authentic volatility observed over a designated timeframe. The calculation entails summing the squared returns of an asset over time and then dividing by the number of periods minus one. The formula for realized volatility is expressed as:
Realized Volatility=√[(∑(Ri – Ravg)²)/(n – 1)]
In this context, Ri signifies the return for period i, Ravg denotes the average return during the specified time, and n represents the number of periods. Understanding these distinct types of volatility equips market participants with valuable tools for navigating the intricacies of financial markets.
Drivers of Stock Volatility
Understanding the factors that contribute to volatility in the stock market is crucial for traders seeking to navigate dynamic market conditions. Several key elements play a significant role in shaping stock market volatility:
- Social Media Influence
The advent of social media platforms, such as Stocktwits, Twitter, and Reddit, has emerged as a potent force, influencing nearly 30% of daily trading volume in the US. Analysts, experts, and even corporate officials, like Elon Musk, frequently share statements on these platforms, impacting stock prices. The meme stock frenzy in 2021 vividly demonstrated how social media users could rapidly drive stock movements through news dissemination and collective actions. - Economic Data Releases
Economic indicators wield considerable influence over market volatility, given their implications for monetary and fiscal policies. Key economic numbers that traders closely monitor include inflation rates, employment data, manufacturing and services Purchasing Managers' Index (PMIs), industrial production, and Gross Domestic Product (GDP). Strong employment and inflation figures may signal potential interest rate hikes by the Federal Reserve, prompting stock declines. Conversely, poor economic data, as witnessed during the onset of the COVID-19 pandemic, might prompt rate cuts, buoying stocks. - Market Sentiment
Market sentiment, categorized as risk-on or risk-off, significantly impacts stock volatility. A risk-on sentiment prevails when investors are inclined to take risks, fostering an environment of greed. Conversely, a risk-off sentiment arises when fear dominates the market, leading to a decline in stock prices. Market sentiment often mirrors the overall market conditions, with rising stocks generating risk-on sentiments and falling stocks triggering risk-off sentiments. - Macro Environments
The broader macroeconomic environment, marked by events such as the coronavirus pandemic in March 2020 or geopolitical issues like trade wars, wars, and natural disasters, can instigate heightened market uncertainty. Investors' reactions to these macro issues contribute to substantial volatility, with rapid sell-offs or strategic buying opportunities depending on the prevailing circumstances. - Earnings Reports
Stocks often experience volatility before and after the release of quarterly earnings reports. Traders engage in forecasting ahead of earnings announcements, and the subsequent market reaction is influenced by factors such as revenue growth, meeting or missing estimates, and guidance provided by the company. Earnings results have the potential to cause gaps, leading to either upward or downward movements in stock prices. - Other Catalysts
Various other factors contribute to stock volatility, including analyst calls, mergers and acquisitions, and company-specific news such as management changes and product launches. Additionally, activities in the bond market, such as yield curve inversions signaling a potential recession or rising bond yields prompting shifts to safer assets, can have cascading effects on stock market dynamics. A holistic understanding of these diverse catalysts is essential for traders aiming to navigate the complex landscape of stock market volatility.
Key Tools for Assessing Market Volatility
Traders face the ongoing challenge of effectively identifying and navigating market volatility. Several top-notch tools have proven invaluable in this pursuit:
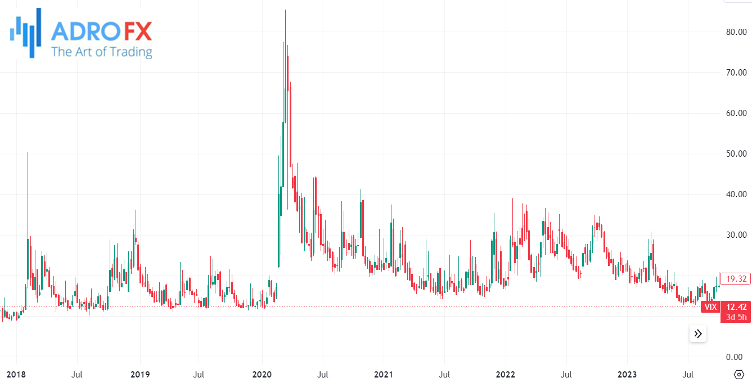
CBOE VIX Index
The CBOE VIX (Volatility Index) stands out as one of the premier tools for gauging market volatility. Specifically designed to assess the performance of S&P 500 stocks, the VIX index is a reliable indicator. A rise in the VIX typically signals an anticipated increase in market volatility.
The chart below shows that the VIX has been elevated in the past five years:
Fear and Greed Index
Developed by CNN Money, the Fear and Greed Index is a comprehensive tool comprised of various sub-indices that collectively assess market sentiment. Sub-indices include stock price breadth, VIX, stock price strength, and junk bond demand, among others. A notably low reading on the Fear and Greed Index serves as an indicator of potential market fluctuations.
Calendars
Calendars play a pivotal role in anticipating events that may contribute to market volatility. Various types of calendars provide insights into critical events:
- Economic Calendar
Highlights scheduled economic events. - Earnings Calendar
Lists companies set to release their financial results. - Dividend Calendar
Identifies companies preparing to pay dividends. - Splits Calendar
Reveals companies planning stock splits.
Access to these calendars empowers traders to prepare strategically for anticipated volatility stemming from economic releases, corporate earnings, dividend payouts, and stock splits.
Other Technical Indicators
In addition to specialized indices and calendars, traders often rely on various technical indicators to measure and analyze volatility. Notable indicators include:
- Average True Range (ATR): Provides an average of price range, aiding in identifying potential market volatility.
- Relative Volatility Index (RVI): Measures the strength of a price movement, helping assess market volatility.
- Historic Volatility: Examines past price movements to gauge the level of historical volatility.
- Bollinger Bands: Utilizes standard deviations to create bands around price movements, offering insights into potential volatility.
These technical tools offer diverse perspectives on market dynamics, allowing traders to make informed decisions in the face of volatility. Integrating a combination of these tools provides a comprehensive approach to understanding and responding to fluctuations in the financial markets.
Strategies for Trading Volatile Stocks
Navigating the complexities of volatile stocks requires strategic approaches to capitalize on price fluctuations. Here are several effective strategies employed by traders in volatile market conditions:
- Buying the Dip or Selling the Rip
Buying the Dip: This involves purchasing a financial asset that experiences an irrational sell-off. For instance, if a stock plunges post-earnings, traders may seize the opportunity to buy the dip, anticipating a rebound.
Selling the Rip: Conversely, traders employing this approach short an asset that has experienced a substantial increase. The expectation is that the asset's price will continue to decline following a significant rise. - Gap and Go
This strategy involves trading in the direction of price gaps, particularly when assets experience notable gaps (up or down). Traders may buy an asset following a substantial gap, holding the position for an extended period. - Scalping
A short-term trading strategy where traders aim to make small profits over multiple quick trades. For instance, a trader might target a $5 profit per trade and execute numerous trades throughout the day. - Using Technical Indicators
Employing tools like moving averages, VWAP (Volume Weighted Average Price), and Bollinger Bands. For example, buying when a stock moves above VWAP and selling when it falls below. Similar principles apply to other indicators. - Trend Following
Traders align themselves with existing trends, either buying in an uptrend or shorting in a downtrend. This strategy often involves using technical indicators (e.g., moving averages) or recognizing chart patterns like bullish and bearish pennants and triangles. - Arbitrage
Involves trading two correlated financial assets simultaneously to capture price differentials. For instance, buying one energy stock while shorting another that tends to move in the same direction.
Each strategy carries its own set of risks and requires careful consideration of market conditions. Successful trading in volatile stocks demands a combination of technical analysis, risk management, and a keen understanding of the chosen strategy. Traders often tailor their approaches based on personal preferences, risk tolerance, and market conditions.
Identifying Volatile Stocks
Determining which stocks exhibit volatility in the market involves employing various strategies. One method is to leverage social media platforms such as Reddit, Twitter, and StockTwits. Typically, the most volatile stocks are those gaining traction on these platforms, as indicated by the activity chart on StockTwits.
Another approach is to utilize websites that monitor the market's top movers. These platforms often feature sections highlighting trending stocks and top movers, exemplified in the chart showcasing popular stocks on Investing.com.
Understanding Volatility Across Market Hours
The American stock market operates in distinct periods, starting with the pre-market at around 4 am, followed by the regular session from 9 am to 4 pm, and concluding with the extended hours. Each period exhibits varying levels of volatility, with pre-market and extended hours being particularly volatile due to major company announcements, such as earnings releases.
The market experiences heightened volatility at its opening, as orders placed during the pre-market are executed, especially pending orders. Following this initial volatility, stocks tend to stabilize during the regular session, only to see increased activity towards the market close as traders exit their positions for the day.
Strategies for Managing Volatility
While volatility can benefit day traders, all traders must safeguard against potential negative impacts. Here are some effective strategies for navigating volatile markets:
- Avoid Overnight Exposure
Given the sharp movements in volatile markets, closing all trades before the market closes helps mitigate uncertainties associated with the next day's opening. - Implement Stop Loss and Take Profit Orders
Utilize Stop Loss orders to automatically exit trades at predefined loss levels and TakeProfit orders to secure profits when specific targets are reached. - Utilize Pending Orders
Instead of market orders, employ pending orders such as buy-stop, sell-stop, buy limit, and sell-limit to have more control over entry and exit points. - Incorporate Trailing Stops
Implement trailing stops, which dynamically adjust with price movements and capture initial profits in case of a reversal, providing a flexible approach to risk management.
Final Thoughts
In the dynamic world of finance, volatility is not just a metric but a potent force that traders can leverage strategically. This exploration of volatility delved into its various types, drivers, and the tools available to traders in navigating market fluctuations.
The GameStop saga in 2021 highlighted the influence of social media on stock prices, emphasizing the interconnected nature of today's markets. Yet, volatility is shaped by a multitude of factors, from economic data releases to market sentiment and macro events.
Traders possess a toolkit comprising indices like the CBOE VIX, calendars, and technical indicators to decipher and respond to volatility. However, successful trading in volatile markets requires more than tools - it demands adaptable strategies and a nuanced understanding of risk management.
In these final thoughts, it's clear that volatility is not just a challenge but an opportunity for traders to craft their strategies. Whether seizing opportunities through buying the dip or employing technical indicators, successful traders embrace volatility's ebb and flow.
As financial markets evolve, those who navigate volatility with knowledge, adaptability, and strategic insight will thrive in the ever-shifting landscape of finance.

About AdroFx
Established in 2018, AdroFx is known for its high technology and its ability to deliver high-quality brokerage services in more than 200 countries around the world. AdroFx makes every effort to keep its customers satisfied and to meet all the trading needs of any trader. With the five types of trading accounts, we have all it takes to fit any traders` needs and styles. The company provides access to 115+ trading instruments, including currencies, metals, stocks, and cryptocurrencies, which make it possible to make the most out of trading on the financial markets. Considering all the above, AdroFx is the perfect variant for anyone who doesn't settle for less than the best.
Related Articles


Latest updates
Latest updates


Technical Analysis
Latest updates


