Technical Analysis Tools
A Deep Dive into 6 Technical Indicators Loved by Professionals for Confident Decision-Making
Day trading relies heavily on technical indicators, serving as the fundamental building blocks for successful trading endeavors. Proficient traders, even those within large financial institutions like Wall Street banks, universally utilize these indicators. Yet, for new traders, these indicators may initially appear intricate and bewildering. However, the key lies not in understanding their intricate calculations but rather in mastering their optimal usage.
Market Volatility: Strategies, Tools, and Insights for Traders
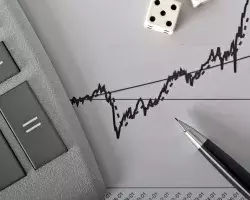
Volatility stands as a pivotal element within the financial market, denoting the degree and speed at which an asset's price changes over time. Greater volatility indicates rapid fluctuations in the asset. For instance, if a stock commences trading at $10, ascends to $13, and then descends to $9 within a single session, particularly in a brief span, it qualifies as highly volatile - especially pertinent for scalpers.
How to Use the DeMarker Oscillator in Trading
Almost all indicator strategies are based on the complex application of analytical tools. Today we will talk about the Thomas DeMark oscillator (DeMarker), which can be an effective addition to any trading strategy. What is the DeMarker Oscillator? The DeMarker indicator was developed by Thomas R. DeMark, a prominent trading theorist, and practitioner, and is described in his book The New Science of Technical Analysis.
The Ultimate Guide to Cluster Analysis
Cluster analysis is a very useful tool that allows you to find the best points to enter the market, thus increasing the efficiency of the trader. Someone hears about it for the first time, for someone it is familiar but incomprehensible. It can be used to understand how the real picture of the market is presented and what ratio is observed between the buyers and sellers. In this article, we will provide an insight into the cluster analysis, learning in detail what it is and how to apply it competently in trading on the financial markets.
Bill Williams Indicators
Bill Williams indicators are familiar to all traders in the world. They are included in every terminal and are the basic tools for technical analysis of the forex market. Their popularity is due primarily to the fact that they were invented by Bill Williams — a successful trader, who created an entire financial institution. In addition, Mr. Williams became known to the participants of the foreign exchange market for his work "Trading Chaos".
Introduction to Forex Technical Analysis Explained 2022
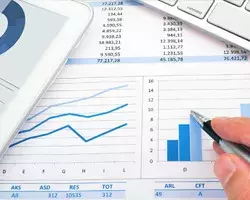
To benefit from price fluctuations on forex, you need to be able to research the market. Understand where the price is going, and based on that, decide whether to enter the game or wait for more favorable conditions. That's what all traders do, not just on forex. A farmer who sells milk knows that if he goes to the market on a sunny Sunday afternoon, he will sell more, and at a better price than on a rainy Monday. He knows that good weather and a day off are two factors that will increase the demand for his product because there will be more people in the market.
Top Technical Analysis Tools for Forex Traders
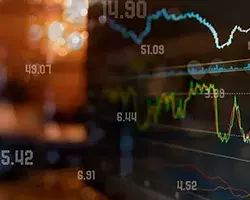
Lately, forex trading with the use of fundamental analysis tools has significantly lost its effectiveness, so the increasing popularity of technical analysis tools. Exactly the analysis is the number one method of studying the situation on the market, and the data obtained are used to make forecasts. Tools for technical analysis are all that help to carry out its implementation. It includes indicators and oscillators, price patterns, as well as the key levels of support and resistance.